I've seen variations of this request a lot, and a wide variety of solutions but this solution is pretty clean and easy so I thought I'd share it.
So I set up a node alert for CPU over the critical threshold, but I also want to include a list of the most recent CPU load of the processes that are in SAM when it fires. SW has the built in example where they launch a program and it scrapes the top xx list but I never liked the lag time between an alert firing and then hoping maybe it works or maybe it doesn't. This method just relies on SQL to grab the latest data from SAM at the time of the alert triggering. If you aren't monitoring a given process as a component in SAM it won't list it here, but in my case I get what I need.
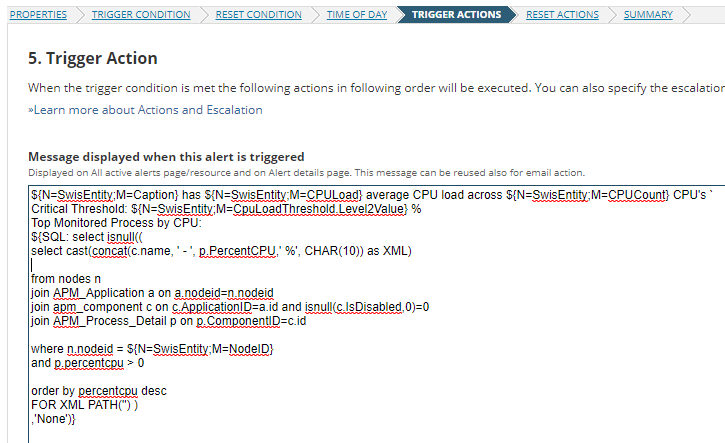
Just add this block of text to the Alert Trigger Message:
${N=SwisEntity;M=Caption} has ${N=SwisEntity;M=CPULoad} average CPU load across ${N=SwisEntity;M=CPUCount} CPU's `
Critical Threshold: ${N=SwisEntity;M=CpuLoadThreshold.Level2Value} %
Top Monitored Process by CPU:
${SQL: select isnull((
select cast(concat(c.name, ' - ', p.PercentCPU,' %', CHAR(10)) as XML)
from nodes n
join APM_Application a on a.nodeid=n.nodeid
join apm_component c on c.ApplicationID=a.id and isnull(c.IsDisabled,0)=0
join APM_Process_Detail p on p.ComponentID=c.id
where n.nodeid = ${N=SwisEntity;M=NodeID}
and p.percentcpu > 0
order by percentcpu desc
FOR XML PATH('') )
,'None')}
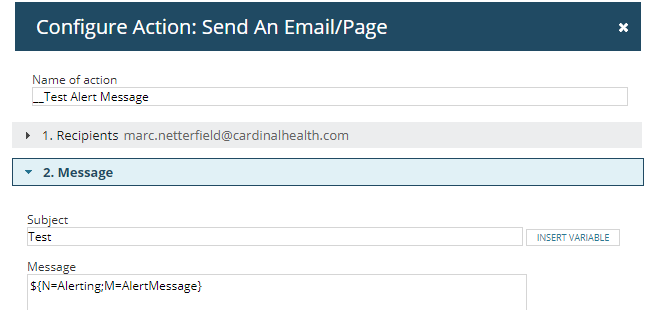
Then in the alert email action I just add in the variable for the alert message
${N=Alerting;M=AlertMessage}
and the result looks something like this
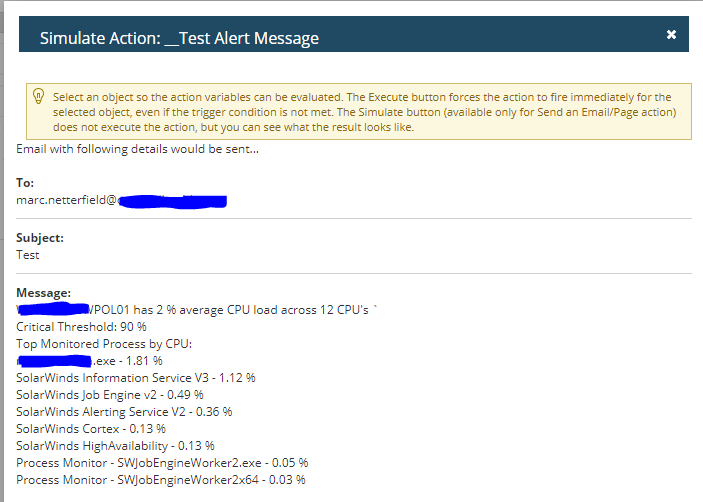
Should only take a few lines of changes to get it to cover the memory alert as well.