This discussion has been locked. The information referenced herein may be inaccurate due to age, software updates, or external references.
You can no longer post new replies to this discussion. If you have a similar question you can start a new discussion in this forum.

Displaying Cause of Component Events

This is has been a thorn in my side with SAM forever and I posted about this in 2014. There still doesn't seem to be a way to simply show why a component is in a "Critical", "Down", or "Warning" state. When looking at a component's page, we can see the event list;

pastedImage_1.png

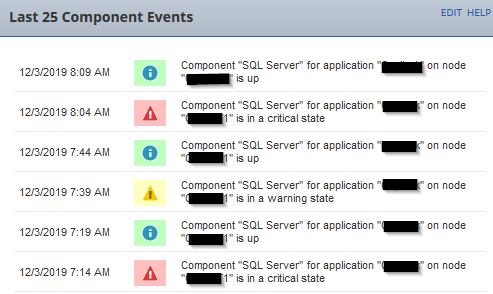
You can also display this on another page with the Application Status resource. What you can't do is show WHY the component is in that state. In the example shot above, it shows that SQL Server is the component and in my case this is usually because the SQL server has high memory or CPU. The only way to see this is to drill down to the component page itself, where it actually shows that. It would be extremely helpful if you could display this info with the component event, IE:

Component "SQL Server" 98% memory. Telling me something is Warning or Critical is not helpful if I have to take extra steps to find out why. If anyone knows of a way to do this, I would love the solution.

Parents
  • So I discovered this and there was a glimmer of hope. But counter intuitively, it shows the memory usage of the NODE in red. I'm assuming the CPU load is also a node value. When I clicked through to the Application page, it clearly showed SQL server using a lot of memory. If it just showed the COMPONENT value of those things, that would be some improvement.

    pastedImage_0.png

Reply
  • So I discovered this and there was a glimmer of hope. But counter intuitively, it shows the memory usage of the NODE in red. I'm assuming the CPU load is also a node value. When I clicked through to the Application page, it clearly showed SQL server using a lot of memory. If it just showed the COMPONENT value of those things, that would be some improvement.

    pastedImage_0.png

Children
  • t0ta11ed74  wrote:

    So I discovered this and there was a glimmer of hope. But counter intuitively, it shows the memory usage of the NODE in red. I'm assuming the CPU load is also a node value. When I clicked through to the Application page, it clearly showed SQL server using a lot of memory. If it just showed the COMPONENT value of those things, that would be some improvement.

    pastedImage_0.png

    Great feedback, I'm tracking the improvement request here internally under SAM-10716