This discussion has been locked. The information referenced herein may be inaccurate due to age, software updates, or external references.
You can no longer post new replies to this discussion. If you have a similar question you can start a new discussion in this forum.

Issue is In/Out Avg bps Step Chart

Dear Thwack Community,

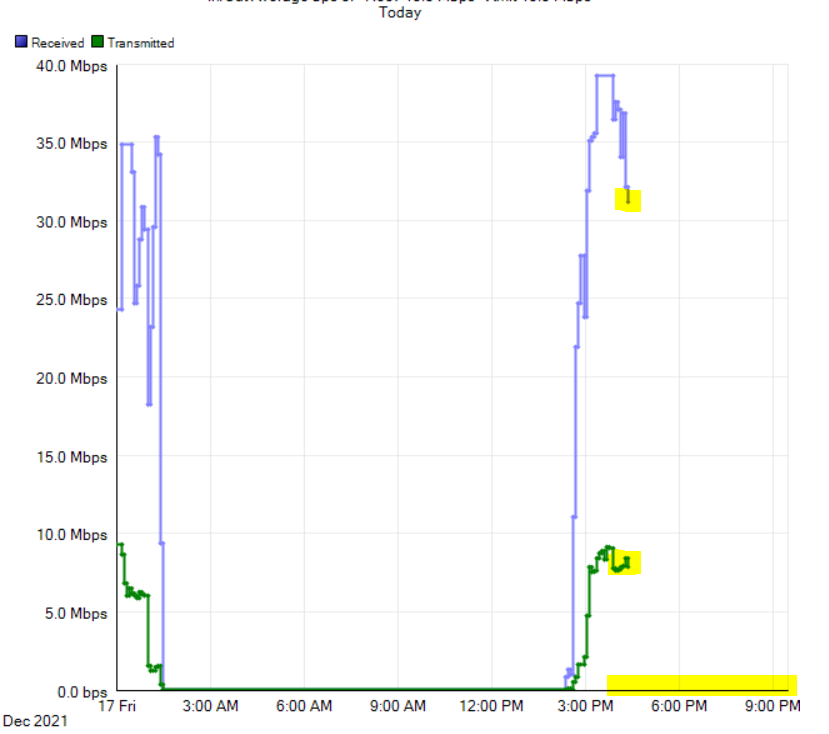
We have upgraded to the latest NPM version but are facing an issue. The step chart of the avg in/out bps of any interface does not sync with the time on x-axis. The values polled are ok but the graphs show these values as if they were polled 5 hours ago. May be there is some issue with the GMT thi because, we are using it in GMT+5. 

Please need help with this. All other graphs are ok.

Thanks in advance.

Regards

Harry

  • Any help provided would be appreciated.

    @dmvrtisjr  @dmvrtisjr 

  • I would check the time on all Orion servers and the database server to ensure that are all using the same time and timezones.

    Try a different browser or use the browser on the Orion server to ensure the issue is not local you your desktop.

    Also try the new perfstack type charts to see if they exhibit the same issue.

    Terry Kay

    Loop1

  • Dear ,

    thankyou very much for the reply. Both the application and database server have their time synched with NTP server. We have checked it on multiple browsers and different end devices. Graphs of perfstack and Avg bit/sec (step chart) do not match wrt time. Perfstack shows real time values whereas the step chart shows the same values but with a difference of 5 hours and that is due to the reason that we are in GMT+5 zone. Could not find any setting where i ca adjust this time.

    Although we have opened a ticket with SW Support but they have been unable to resolve despite multiple reminders and many days have passed.

    Lets see what can be done next.

  • hi run database maintenance manually once , this might solve your problem. Just give it a try.