Meraki organization to Orion NPM
To monitor Meraki infrastructure with NPM, add the Meraki organization to the SolarWinds Orion database as an external node.
Each Meraki organization monitored with NPM uses a node license.
Log in to the Orion Web Console as an administrator.
Click Settings > Manage Nodes, and click Add a Node.
In Polling Method, select Meraki Wireless: API.
The Polling Hostname or IP Address is disabled and dashboard.meraki.com is used as the default host name for Meraki networks.
Provide the API Key you generated in the Cisco Meraki Dashboard.
If you have multiple organizations registered, click Get Organization List, and select the organization. If you have one registered organization, it is selected by default.
Polling Meraki organizations uses the global HTTP proxy settings. To change the defaults, click the Configure proxy link.
Review and adjust the device properties.
Review your API key, organization, and proxy settings.
To edit how often the node status, or monitored statistics are updated, change the values in the Polling area.
For critical nodes, you may need to poll status information or collect statistics more frequently than the default polling intervals.
Enter values for custom properties for the node.
The Custom Properties area is empty if you have not defined any custom properties for the monitored nodes. See "Add custom properties to nodes" in the Orion Platform Administrator Guide.
To adjust when the status of the node changes to Warning or Critical, edit alerting thresholds for the metric. Select the Override box and set thresholds for the node.
Click OK, Add Node.
The Meraki organization is now monitored as a wireless controller node. After the first poll, you can see the data from the device in the Orion Web Console.
On the Manage Nodes view, click the added node to see the node details in the Wireless Controller view, or drill down into thin access points listed on the view.
Monitor Meraki organizations
Click My Dashboards > Network > Wireless to see monitored Meraki organizations in the Wireless Overview and to view monitored controllers, access points, and clients.
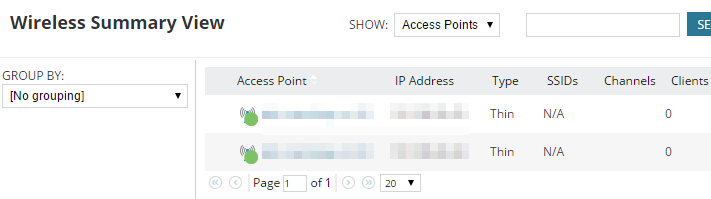
To find out access points on a controller, select Controllers in the Group by list.
Click a wireless access point to see details of the access point, such as the controller details, thin access point details, active wireless clients and wireless clients connected in the past.
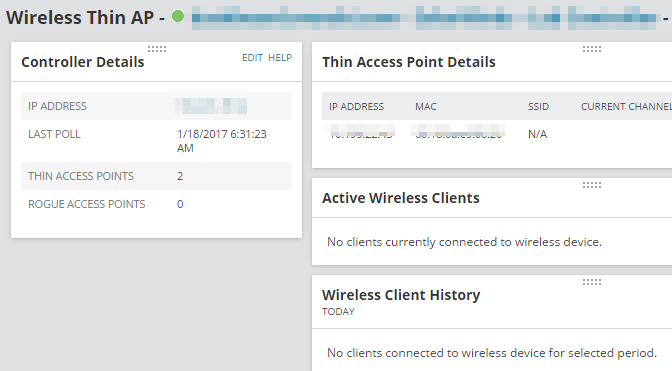
Click the controller name to see the wireless controller details, such as node details or list of thin access points.