Upgraded tot 2019.4, and therefore moved to the new log viewer. We had the last syslog messages on our dashboard, but that doesn't work anymore.
Is this going to be replaced? does anyone has an wsql query available?
Syslog has been replaced by log viewer.
To see syslogs associated with a node, I added a SWQL query widget to the view with the following code
SELECT TOP 100 -- Edit this number for how many messages you want to load to widget (you can modify the widget for how many messages to page)
let.Name AS [Message Type]
,Level AS [Severity]
,TOLOCAL(DateTime) AS [Log Time]
,SUBSTRING(Message,1,100) AS Message -- Edit the last number for how many characters of the message you want to see
,CONCAT('YOURORIONURLHERE','/ui/orionlog/logviewer/now/1hours/',${NodeID},'/syslog') AS _linkfor_Message --Replace YOURORIONURLHERE with the address ex: 'https://orion.abc.com'
FROM Orion.OLM.LogEntry le
JOIN Orion.OLM.LogEntryType let ON le.LogEntryTypeID = let.LogEntryTypeID
WHERE NodeID = '${NodeID}'
--AND le.Message LIKE '%${SEARCH_STRING}%' -- Remove The -- From beginning for the "Search SWQL Query" Box
ORDER BY DATETIME DESC
I added the node caption field as well for anyone interested. We just need some color.
SELECT TOP 10let.Name AS [Message Type],Level AS [Severity],nod.Caption AS [Node],TOLOCAL(DateTime) AS [Log Time],SUBSTRING(Message,1,100) AS Message,CONCAT('https://orion.xxxxxxxx.com','/ui/orionlog/logviewer/now/1hours/',${NodeID},'/syslog') AS _linkfor_MessageFROM Orion.OLM.LogEntry leJOIN Orion.OLM.LogEntryType let ON le.LogEntryTypeID = let.LogEntryTypeIDJOIN Orion.Nodes nod ON le.NodeID = nod.NodeIDWHERE Message NOT LIKE '%LINEPROTO-5-UPDOWN:%'AND Message NOT LIKE '%LINK-3-UPDOWN:%';AND Message NOT LIKE '%ASA-6-722022:%';AND Message NOT LIKE '%ASA-6-722023:%';ORDER BY DateTime DESC
So I put in the above, but I'm getting traps returned instead of syslog data. I'm running 2022.3.0.
I'm not sure why you are seeing only traps instead of syslog. Interesting.
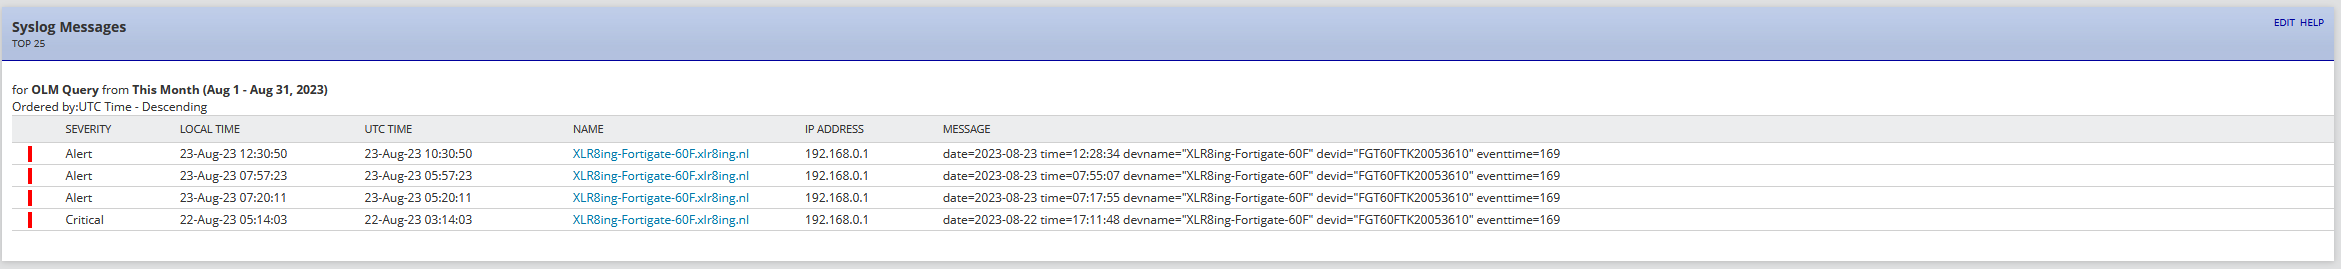
Hi All, I have created a query for someone. And for this person the response was good. The Query: SELECT TOP 25 TOLOCAL([LogEntry].DateTime) AS [Local Time] , TOUTC([LogEntry].DateTime) AS [UTC Time] , CONCAT('', [LogEntry].LogMessageSource.OrionNode.Caption, '') AS [Name] , [LogEntry].LogMessageSource.OrionNode.IPAddress AS [IP Address] , CASE WHEN [LogEntry].LogEntryLevelID IN (1,2,7,8,10,11,17,25,26) THEN '/Orion/images/SeverityIcons/Critical.png' WHEN [LogEntry].LogEntryLevelID IN (3,14,18,24) THEN '/Orion/images/SeverityIcons/Warning.png' WHEN [LogEntry].LogEntryLevelID IN (4,5,9,12,13,19,21,22,23,27) THEN '/Orion/images/SeverityIcons/Informational.png' WHEN [LogEntry].LogEntryLevelID IN (6,15,16,20,28) THEN '/Orion/images/SeverityIcons/Unknown.png' END AS [Status] , [LogEntry].Level AS [Severity] , SUBSTRING(Message,1,100) AS Message , [LogEntry].LogEntryLevelIDFROM Orion.OLM.LogEntry(nolock=true) AS [LogEntry]WHERE [LogEntry].LogEntryLevelID IN (1,2,3,7,8,11,14,17,18,24,25,26) AND [LogEntry].LogEntryTypeID = 1 AND [LogEntry].LogMessageSource.OrionNode.Caption LIKE '%forti%'ORDER BY DATETIME DESC-- Remove all comments when pasting this Query in Orion-- Below the LogEntryLevelID'-- Level Description-- ==== ==============-- 1 Critical -- 2 Error -- 3 Warning -- 4 Information -- 5 Verbose -- 6 Unknown -- 7 Alert -- 8 Critical -- 9 Debug -- 10 Emergency -- 11 Error -- 12 Informational-- 13 Notice -- 14 Warning -- 15 Unknown -- 16 Unknown -- 17 Error -- 18 Warning -- 19 Information -- 20 Unknown -- 21 Trace -- 22 Debug -- 23 Info -- 24 Warn -- 25 Error -- 26 Fatal -- 27 Verbose -- 28 Unknown I added both Local and UTC time in the query. This so the end users over different time zones can speak the same time. But they can also see the time in their own local time (which might give a better reference).
I try to avoid using text in my statements. This slows the query very much when searching the DB. E.g. I do not use Orion.OLM.LogEntry.Level. I prefer to use the Orion.OLM.LogEntry.LogEntryLevelID with an Include statement.
I avoid JOIN statements as much as possible. Within SWIS you can make use of the powerfull Navigation Properties. These Navigation properties can be identified in SWQL Studio. Just look for the chain link icon in the table/view. An example of this navigation property is [LogEntry].LogMessageSource.OrionNode which is a link to the table Orion.OLM.LogMessageSource. And from this table it is linked to the View Orion.Nodes.
I put the Query into a custom table and it looks like the following:
Cheers, Edwin
Hi Edwin, this query is great thank you for sharing!
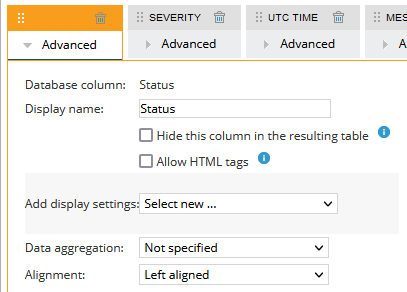
I did have one question though. When I try to implement this myself the status column does not show the .png which is dynamically assigned but instead shows the entire URLI can see you are using a custom table to show the results. How should this be formatted so that it shows the .png?Thank you
Good day @edwinhoekman
I have been trying to replicate the Table you generated using the SWQL query you provided above, but my table continually states "No activity to report". Is there an adjustment that I am missing in your query?
Barry