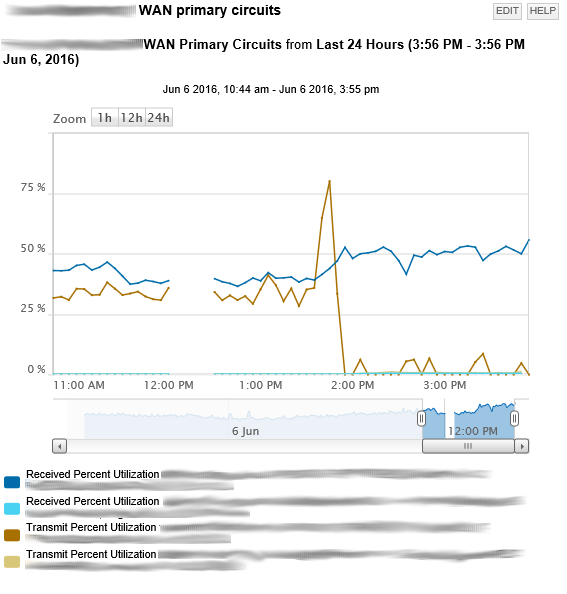
I have an historical chart showing utilization for two WAN circuits. One is 300 meg, the other is 100. These bandwidths are shown correctly on the Edit Properties for each interface. We have noticed that anytime the utilization maxes out, the graph line goes to baseline, i.e bottoms out.
Any ideas on the cause? Thanks.