Hi!
Currently i have a Summary View for my Environment Check (Humidity and Temperature). I created Universal Custom Poller to get the value from Multiple Nodes. Now with the release of the New version of NPM. i really love the new interactive chart, but the problem is that I can't use it on a Universal Custom Poller in a Summary view. If I put it on the node view it will work, but only the Universal Custom Poller for that node only. I need to put many Universal Custom Poller on one view for easier monitoring.
Here is my Summary View for Environment Check.
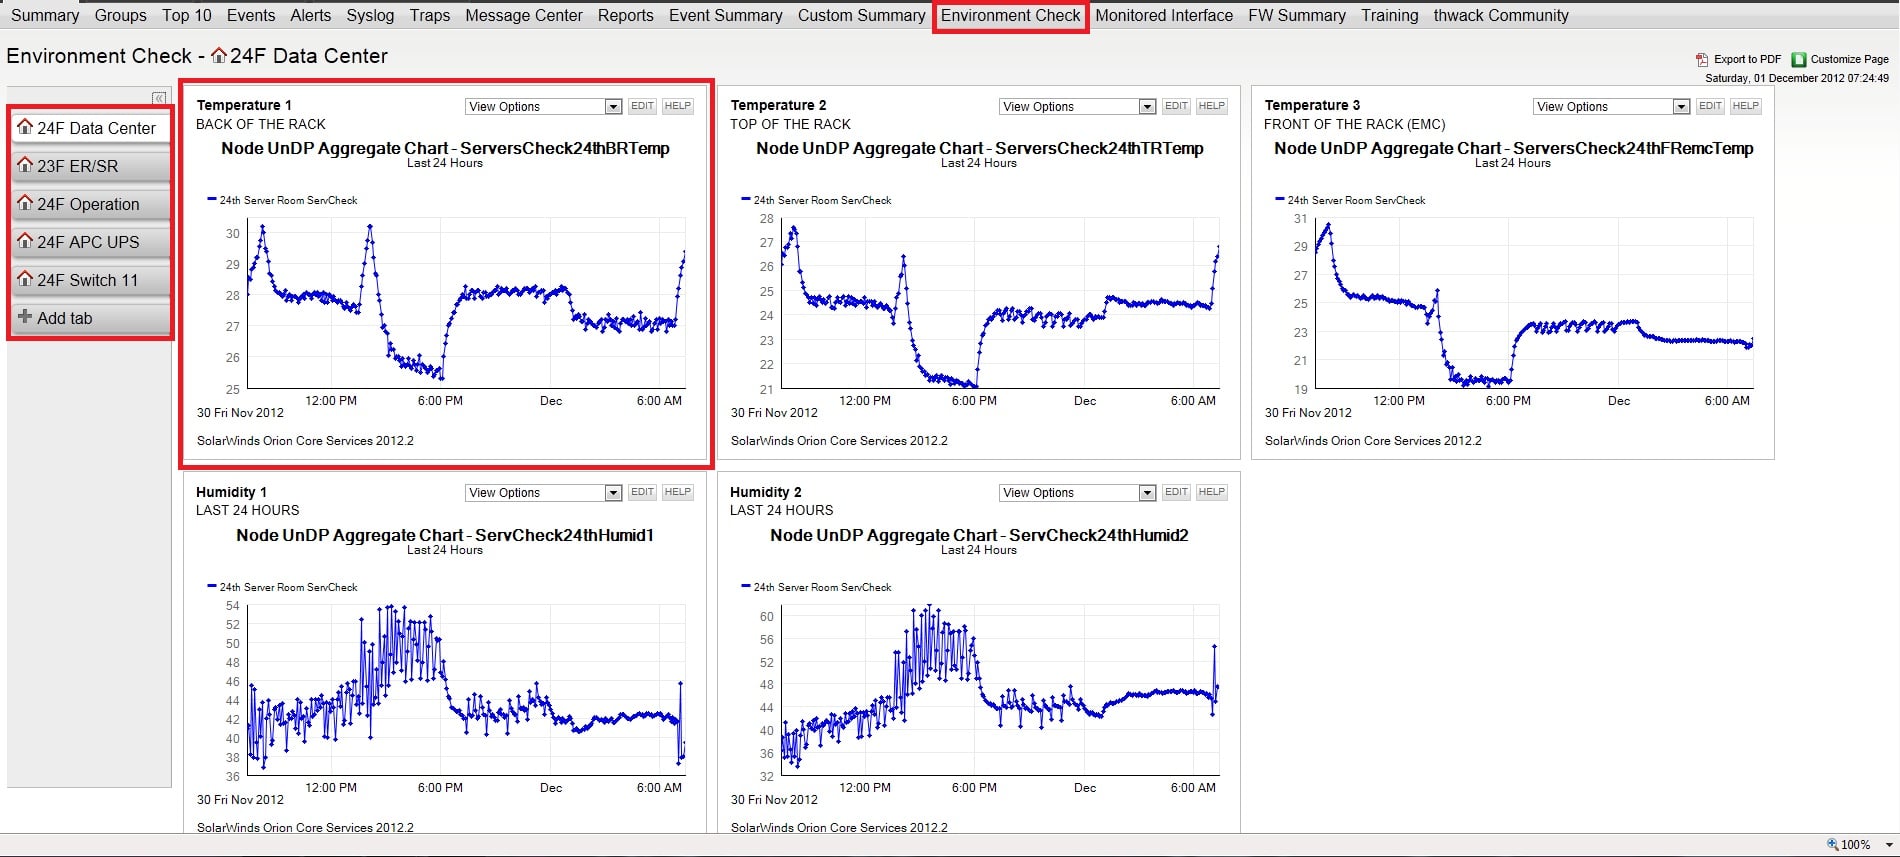
the chart plain ugly
I Created a new view. here it is, node detial type of view.
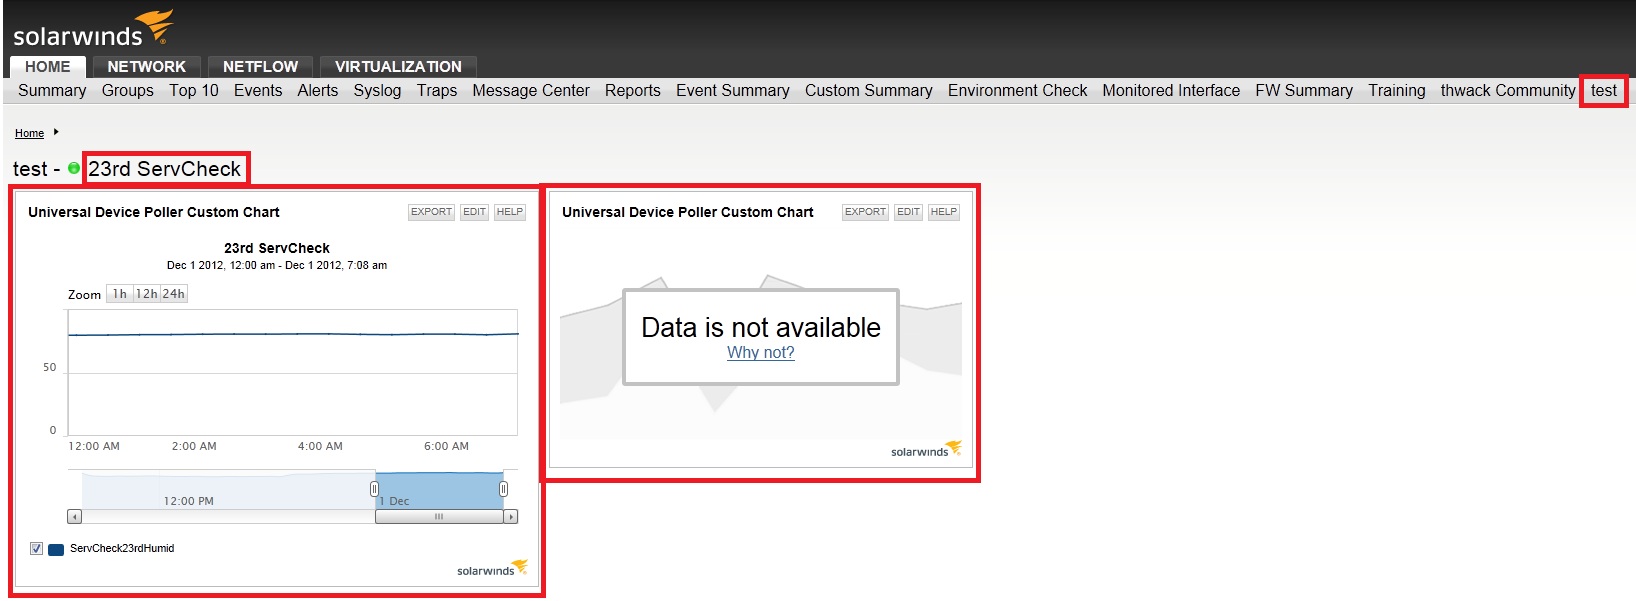
here the interactive chart works but for 1 node only if i add a chart for a custom poller from another node it doesn't display.
anyone know how to do it?