EOC is meant to provide comprehensive view of the instances in distributed deployment but it is a half developed product.
It has various limitations that one must be aware off.
Various limitations found:
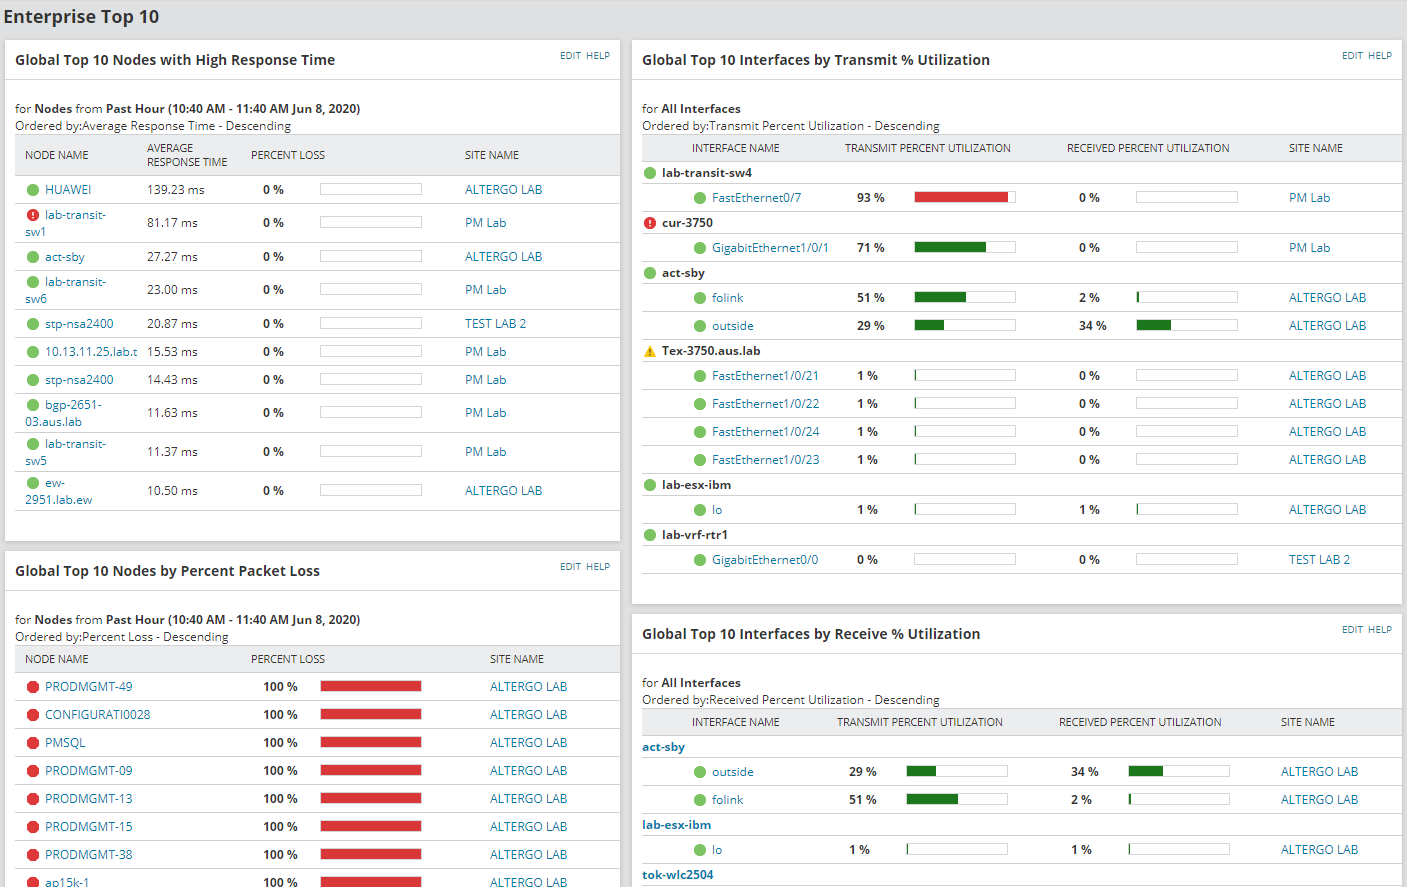
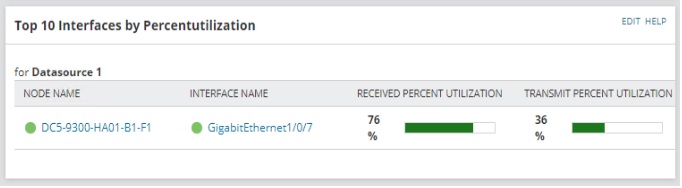
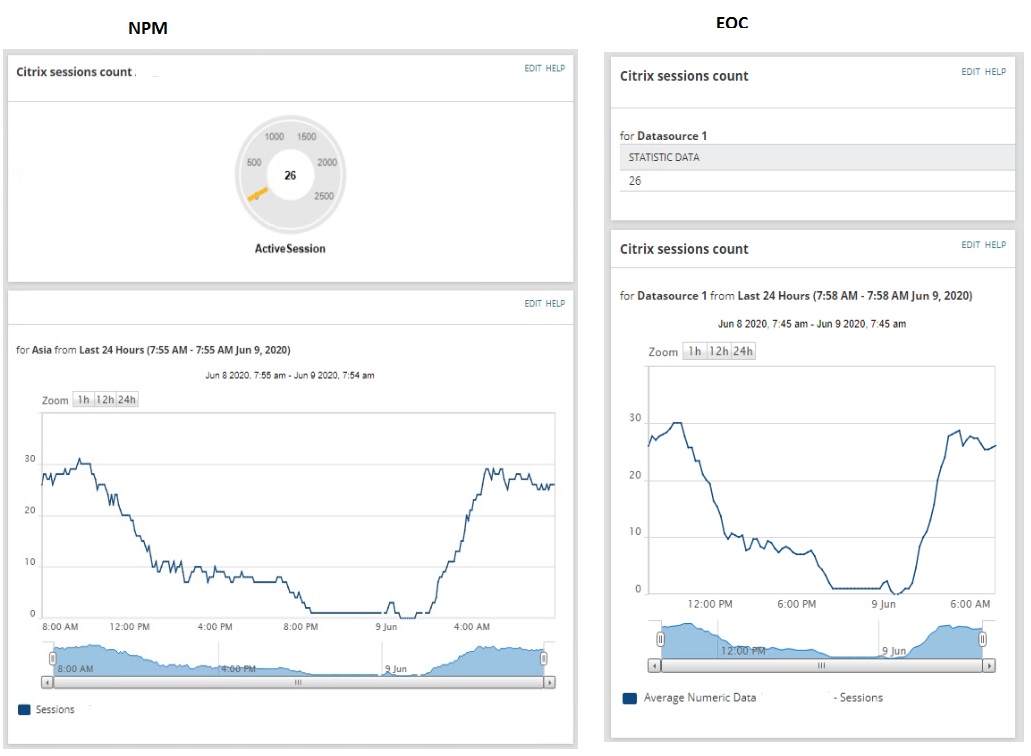
1. Top 10 Interfaces by Percent Utilization widget is missing, there will be other widgets missing but i have not fully explored yet
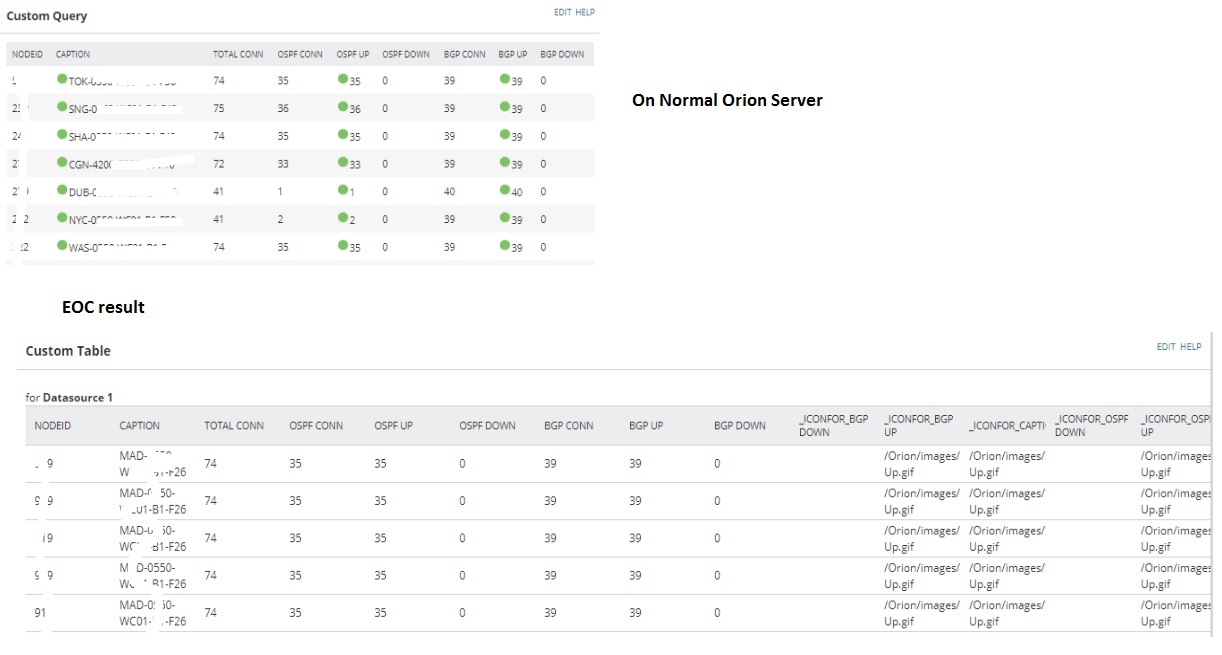
2. Custom table resource does not have SQL option, only runs SWQL
3. Custom Resource to display radial gauge is missing
4. No way to represent Universal Poller information in Radial or in custom resource.
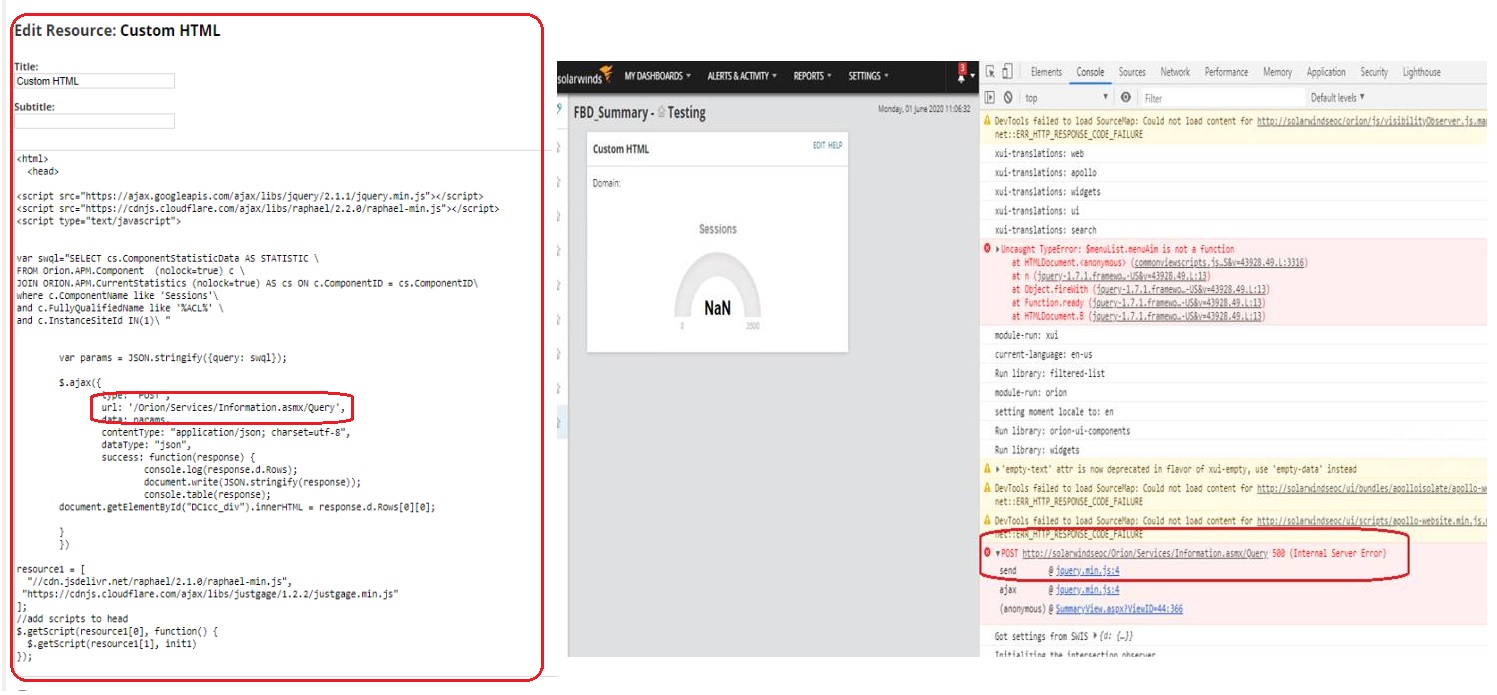
5. Does not support JSON query
6. Has limited options, other products can not be installed along with EOC
7. SAM components can not be represented on Dashboards