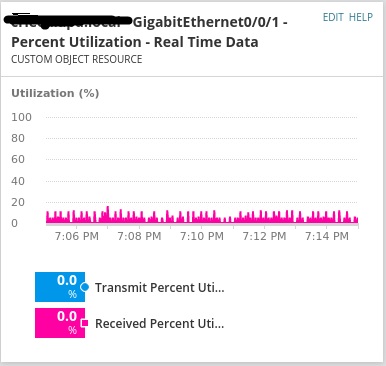
I would like to duplicate and modify the chart Percent Utilization - Real Time Data on an interface.
The reason for this is that the default chart show only 10 minutes of information.
There are other charts that allow the 2 hour window but that are not organized as well.
How do I duplicate this chart and modify it to show a 2 hour window?