Hi,
I am trying to create a Network Map using Network Atlas to monitor the link utilization between our core network nodes for our NOC.
There are no 3rd Party ISP's / Network Providers involved in any of these links, they are all our own fibre on our own private network.
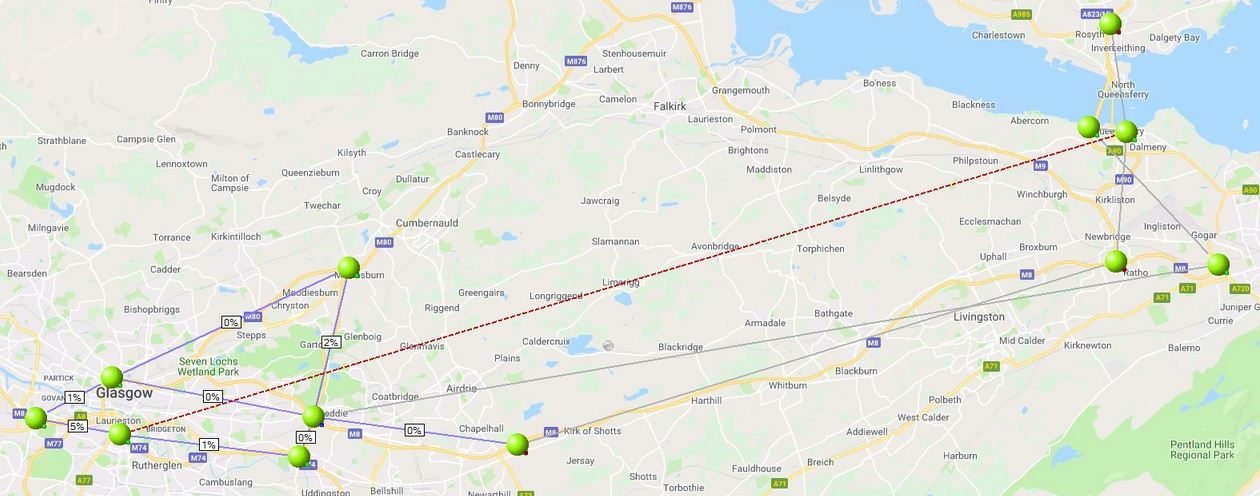
Below is an overview of what I currently see when using Network Atlas - as you can see only some of the links show the % utilization on them, some are greyed out and one is red (saying there is no link between them).
If I look at the links that are showing the utilization and look at the topology information, the nodes show both L2 & L3 connections between sites.
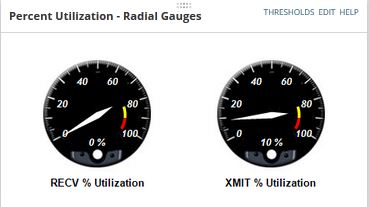
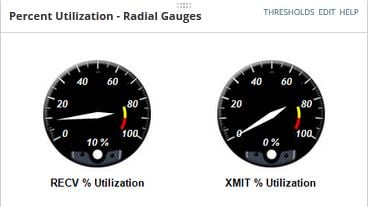
If I look at the links that are grey / red and look at the topology information on these nodes I only see L3 connections between nodes and no L2 connections but each node separately does show the link utilization for the link between them - see below (send / receive of one link)
All nodes have Toplogy-L2 & Toplopgy-L3 connections selected in list resources and I have selected the option to update the topology information, and even left it a few days just to be sure but still nothing on the links that only L3 connections between sites.
If I don't use the 'Show Link Utilization' radial on Network Atlas I can then add a manual label on each of the lines and parse either ${OutPercentUtil} / ${InPercentUtil} or ${Outbps} / ${Inbps} and this shows me values, but its not as neat and with some of the sites being close together its not clear as to what values are for what links.
So basically I'm trying to find out why Network Atlas won't show link utilization if there is no L2 information available or why my core nodes which are all Cisco 6500 devices show L2 information for some links but not others.
If this is just the way that Network Atlas is, then is there a better way of presenting the data using the labels, or any other way to get it looking neater?
Thanks in advance.
Duncan