I'm trying to keep my alerts clean. I would like to monitor just the hard drive space of specific servers. I can't seem to find the right template or create a custom template to match my needs.
Where am I missing it?
Thanks in advanced!
-Stephen
I added a Custom Property to my volumes called "Mute", but you could do the opposite and make it "Alert", then in you alert, you would add the condition that custom Property "Alert" = "Yes". Now every volume you want to alert on would need that property set to Yes. But if you do the "Mute" way to include all except the ones you want to mute, make sure to create a condition group that uses any and is for "Mute" = "No" or "Mute" is "empty".
Leon did a great thread on this here.
I am a noob to this software. My company just purchased it this past week. We had the IP monitor and I ran the migration tool over to APM, then upgraded to SAM. It created the nodes but I am having to manually create the PING, HTTP, and Drive Space alerts. I was able to find the right stuff for HTTP and PING. I read through that thread by Leon but it didn't really add up for me. I guess that I need it sent to me in dumby terms..... Where do you create the "mute" property and why can't I see the drive space on any of my nodes volumes? I think that I'm missing something completely or I'm just not understanding this whole thing. Thanks for the patience!
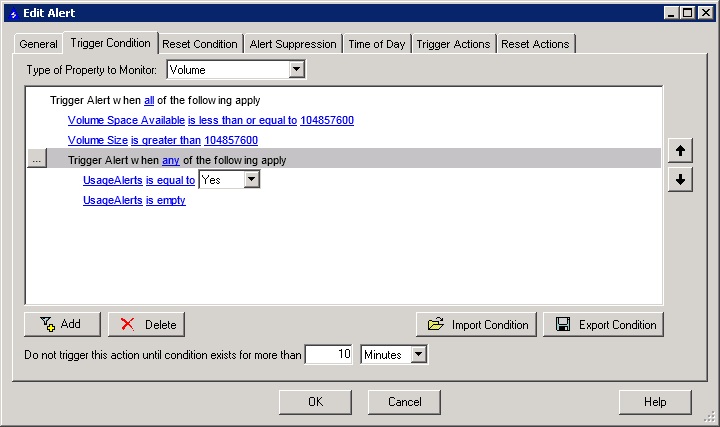
To create custom properties, you need to use the fat client, TS to the orion server, start, programs, solarwinds orion, grouping and access controll, custom properties editor. Add, build a custom..., Add Property to "Volumes", put in the name, then I would use with the "Yes/No" (text would work too). Then the alert would look something like (Hey, I didn't use Mute on volumes!):
To see the current space, you could run a report, or go to the specific node's details web page and it should be on there. Stuff could even be in the Top 10 list (That's what I use a lot).
Now that makes more sense! I am going to try this out today. Does this alert run for every node or do you have to specify some where? Is the "Volume Space Available" alert able to monitor percentage rather than a specific GB size and does this work for all drives on the server (C:\,E:\,F:\,etc....)?
I see where you are talking about the top10 but for some reason it isn't showing my drive space.
I was able to setup the alert like you showed me above. Thanks for the help with that!
With the way the alert is setup in that screen shot, it is all servers unless the individual volume has had the "UsageAlert" set to something other than "Yes" (like no). but you could add another "any" condition group and have that list the servers, but you could remove the "is empty" and then you have to go to each volume you want to monitor and set the Custom Property. It's really up to you, I have it bring in "is empty" because I want everything to be monitored unless it is a one off case that I know is ok when the drive it full. Yes, you can use % it is one of the selectable choices. I don't like % because 10% of a 5GB drive is 500mb (most of my web servers), but 10% of a 10TB is 1tb (by BackupExec server). Now I have been thinking about setting up the per volume adjustment the way Leon set it up here, but that's more work for me to do (sure it's only an hour to setup, but how long will it take to tune and debug when this is already done.) Read that one though. If you are doing the work now, you might want to do it that way.
If that top 10 list isn't being populated, that might be why you cant find the volumes in the web page. They may not have been moved/selected.open your https://orion/Orion/Admin/Details/Engines.aspx, how may volumes does it show to the right of "Volume Elements"
So is this not the correct trigger?
I set the variables, but they aren't working properly. The NodeName works without any issues. It's the volume variables that I can't seem to work out. I read through some other threads about the variables as well. None of them seem to work for me. This thing is really frustrating so far. Sure hope it gets better...
did you check to make sure the volumes got imported? I know that's just too simple, but if your top 10 list isn't populated, then you might not be getting the data from the server and there is no amount of alert troubleshoot that can fix missing data.
Gotcha.... I checked the spot you mentioned. What do I need to to do now?
Get the volumes monitored.
Either go to each node and click list resources and check off the volumes you want, or run a discovery (either against your subnets or a list of IPs/hostnames) and import them that way..