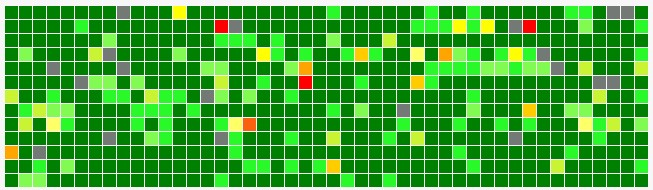
Has anyone been able to create a RAG dashboard such as the image below where each small square represents a server or virtual host? It would be really handy for a very fast overview of the state of the infrastructure.
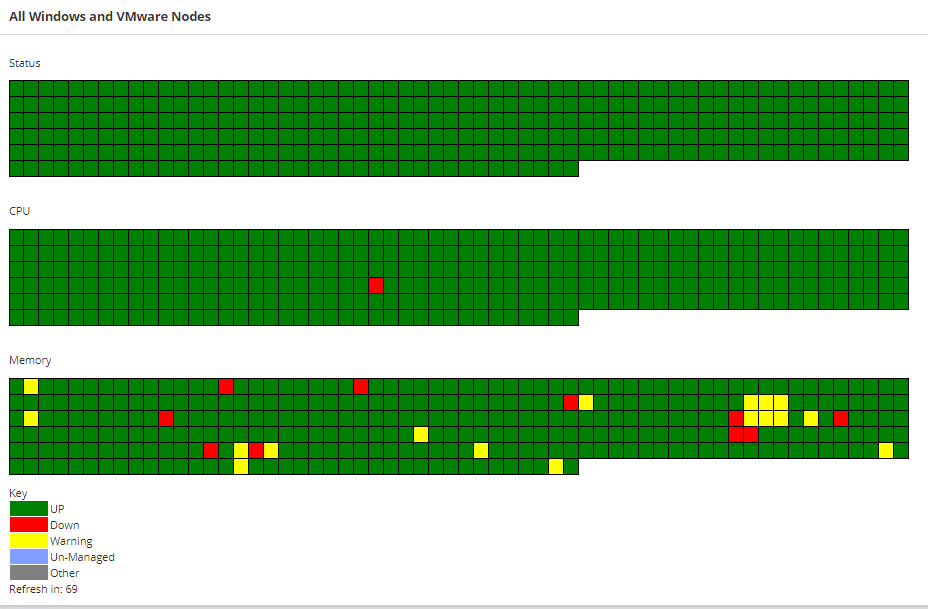
@wluther Thanks for your help and examples of your work. I now have a dashboard that I think will do the job just fine. Each square represents a windows or vmWare node and the locations are the same in each table.
@james.heads While it's not exactly what you are looking for, here is a heatmap being used with data pulled via SWQL queries.
https://thwack.solarwinds.com/t5/NPM-Documents/Using-Your-Custom-HTML-Resource-To-Properly-Display-SWQL-Query/ta-p/529179
Additionally, there are numerous other links to some good user content found here:https://thwack.solarwinds.com/t5/naroot/How-to-do-various-customizations-with-your-Solarwinds/td-p/371780
While I have not put together exactly what you are wanting, I have certain seen that standard heatmap option in Highcharts, and I think maybe even Google charts too. It shouldn't take too much poking around to figure out how to swap styles. (says the guy who usually takes too long poking around to figure things out...)
Let us know what you find, and how it goes.
Thank you,
-Will
@wluther Thanks for the reply and the mountain of info. There goes all my free time
@wluther What do you use to compile and test your code? I'm using notepad++ and pasting in to the custom HTML widget but finding it hard to find and fix any issues due to the lack of error messages and feedback.
@james.heads
First rule of THWACK club... Always talk about THWACK club!! Wait, wrong thread...I use Notepad++, Visual Studio Code, and (of course) the Orion SDK.
https://code.visualstudio.com/
https://github.com/solarwinds/OrionSDK
Also, you should be able to test your code (minus the "live" data) in something like https://jsfiddle.net/.
Additionally, you can use the "Developer Tools" option in Chrome or FF. (CTRL-Shift-I, F12, or something like that...) Once you have the dev tools option enabled, you can track errors via the console, so make sure to add log points throughout your code.
@james.heads That's a really nice and clever looking display. If you have a few minutes, and don't mind, would you please share your solution for me to steal others to use?
@wluther see below..... not the most elegant or best coding in the world but somehow works
<div id="container" style width:2000px; height:100%> <div id="UpDown" style width:100%></div> <p><div id="CPU" style width:100%></div> <p><div id="Memory" style width:100%></div> <p><div id="Key">Key<br><table><tr><td bgcolor="green"></td><td>UP</td></tr><tr><td bgcolor="red"></td><td>Down</td></tr><tr><td bgcolor="yellow"></td><td>Warning</td></tr><tr><td bgcolor="#809fff"></td><td>Un-Managed</td></tr><tr><td bgcolor="grey"></td><td>Other</td></tr></table></div><div id="countdown"></div> </div><style> div { text-align: left; text-indent: 0px; padding: 0px 0px 0px 0px; margin: 0px 0px 0px 0px; } #up { background: green; color: green } #up a { display: block; text-decoration: none; color: green; } #down { Background: Red; color: Red; } #down a { display: block; text-decoration: none; color: red; } #warning { Background: Yellow; color: Yellow; } #warning a { display: block; text-decoration: none; color: yellow; } #unmanaged { Background: #809fff; color: #809fff; } #unmanaged a { display: block; text-decoration: none; color: #809fff; } #other { Background: grey; color: grey; } #other a { display: block; text-decoration: none; color: grey; } #mytable1 { border : 1px solid black; border-color: black; text-align:center; width: 1000px; border-collapse: collapse; } #mytable1 td, th { width: 10px; height 100px; border: 1px solid black; } </style> <div id="mainfunc"><script>var nodes="SELECT NodeID, CPULoad, PercentMemoryUsed, Status FROM Orion.Nodes WHERE Vendor LIKE 'Windows' OR Vendor LIKE 'VMWare inc.' ORDER BY Caption" var params = JSON.stringify({ query: nodes, parameters: { } }); $.ajax({ type: 'POST', url: '/Orion/Services/Information.asmx/QueryWithParameters', data: params, contentType: "application/json; charset=utf-8", dataType: "json", success: function(response) { //var myJSON = JSON.stringify(response); //document.getElementById("nodes").innerHTML = myJSON; // DRAW THE Up/Down TABLE var perrow = 60, // 60 items per row html = "<p>Status</p><table id=\"mytable1\"><tr>"; // Loop through array and add table cells for (var i=0; i<response.d.Rows.length; i++) { html += "<td " if (response.d.Rows[i][3] == 1){ html += "id=\"up\" "; } else if (response.d.Rows[i][3] == 2){ html += "id=\"down\" "; } else if (response.d.Rows[i][3] == 3){ html += "id=\"warning\" "; } else if (response.d.Rows[i][3] == 9){ html += "id=\"unmanaged\" "; } else { html += "id=\"other\" "; } html += "> <a href=\"https://pc01-sw1001.d59.tes.local/Orion/NetPerfMon/NodeDetails.aspx?NetObject=N:" + response.d.Rows[i][0] + "\">" + response.d.Rows[i][3] + "</td>"; // Break into next row var next = i+1; if (next%perrow==0 && next!=response.d.Rows.length) { html += "</tr><tr>"; } } html += "</tr></table><br>"; // ATTACH HTML TO CONTAINER document.getElementById("UpDown").innerHTML = html; // DRAW THE CPU TABLE var perrow = 60, // 60 items per row html = "<p>CPU</p><table id=\"mytable1\"><tr>"; // Loop through array and add table cells for (var i=0; i<response.d.Rows.length; i++) { html += "<td " if (response.d.Rows[i][1] < 80){ html += "id=\"up\" "; } else if (response.d.Rows[i][1] >= 90){ html += "id=\"down\" "; } else { html += "id=\"warning\" "; } html += "> <a href=\"https://pc01-sw1001.d59.tes.local/Orion/NetPerfMon/NodeDetails.aspx?NetObject=N:" + response.d.Rows[i][0] + "\">" + response.d.Rows[i][3] + "</td>"; // Break into next row var next = i+1; if (next%perrow==0 && next!=response.d.Rows.length) { html += "</tr><tr>"; } } html += "</tr></table><br>"; // ATTACH HTML TO CONTAINER document.getElementById("CPU").innerHTML = html; // DRAW THE Memory TABLE var perrow = 60, // 60 items per row html = "<p>Memory</p><table id=\"mytable1\"><tr>"; // Loop through array and add table cells for (var i=0; i<response.d.Rows.length; i++) { html += "<td " if (response.d.Rows[i][2] < 80){ html += "id=\"up\" "; } else if (response.d.Rows[i][2] >= 90){ html += "id=\"down\" "; } else { html += "id=\"warning\" "; } html += "> <a href=\"https://pc01-sw1001.d59.tes.local/Orion/NetPerfMon/NodeDetails.aspx?NetObject=N:" + response.d.Rows[i][0] + "\">" + response.d.Rows[i][3] + "</td>"; // Break into next row var next = i+1; if (next%perrow==0 && next!=response.d.Rows.length) { html += "</tr><tr>"; } } html += "</tr></table>"; // ATTACH HTML TO CONTAINER document.getElementById("Memory").innerHTML = html; } })var countdown;(function countdown(remaining) { if(remaining <= 0) location.reload(true); document.getElementById('countdown').innerHTML = "Refresh in: " + remaining; setTimeout(function(){ countdown(remaining - 1); }, 1000);})(120);</script> </div>