I think this chart/statistics is pretty awesome for characterizing the load on an interface:
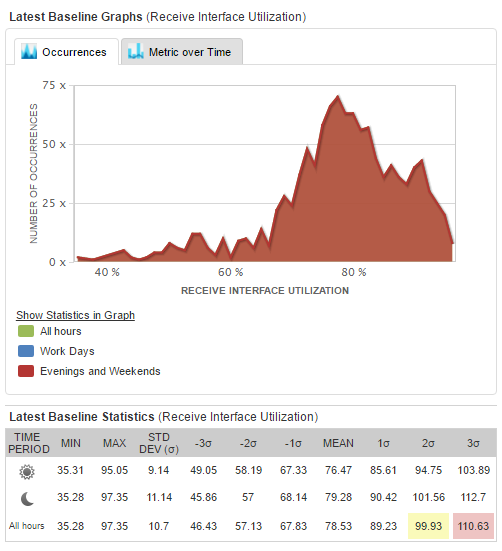
However it's buried under the edit interface properties, custom thresholds, see current baseline data
(which means non-admins here cannot see this information)
is this resource available elsewhere?