Hi everyone,
May I request some help on a timeseries chart in modern dashboard?
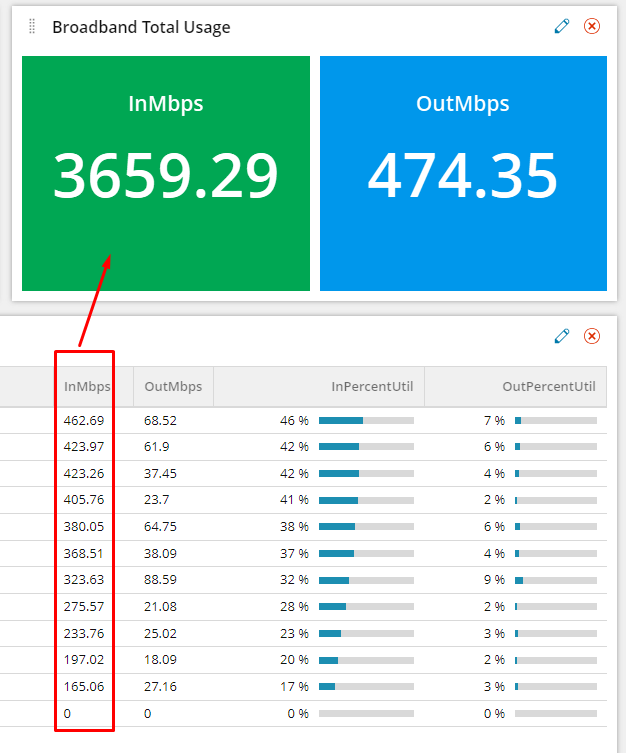
I am creating a dashboard for all our internet line and I would like to create a timeseries chart for the summarized Inbps and Outbps of all internet line, but the problem is that modern dashboard seems only support the PerfStack graph.
Does anyone know how to generate the timeseries chart for the summarized bandwidth? Thanks very much in advance.