hello, good morning
I have a problem with solarwinds graphics. I opened many tickets in solarwinds support, but no one knows how to solve the problem, that's why I ask in this forum.
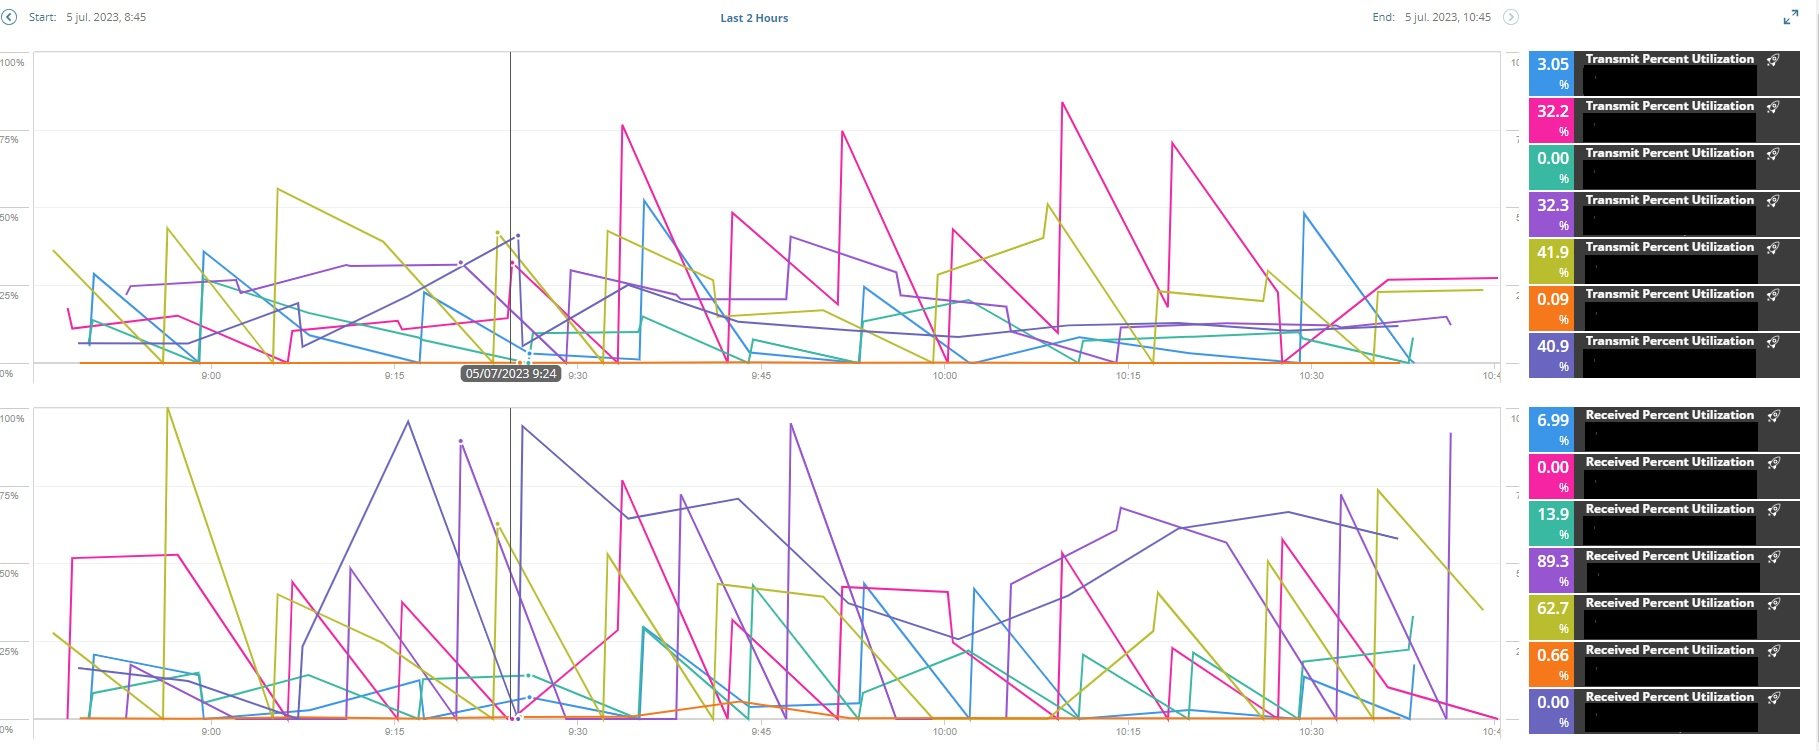
when I changed the configuration from snmpv2 to snmpv3, the graphic corresponding to the percentage of transmission/reception utilization corresponding to the wan interfaces started to show different spikes in the graphic. Does anyone know what this may be due to?
sorry for my english, i don´t speak very fluently English!