Everyday I seem to have a few nodes that are reporting a near constant 100% CPU usage and a critical status. This triggers an alert and when I go check the node the CPU is not even close to 100%. When we compare the recent past with vSphere's monitor they do not closely match either. I have noticed that if I launch PerfStack and start RealTime polling of the CPU all of a sudden it drops to the correct levels and the status turns green soon thereafter. Is this a known bug or is there any fix for this? The VMware team is doing extra work checking these all the time to validate if they need more CPU resources and I'd like to tell them there is a permanent fix for this now or coming.
I've seen similar issues like this before but not exactly the same so I thought I would inquire with you all.
Thanks in advance!
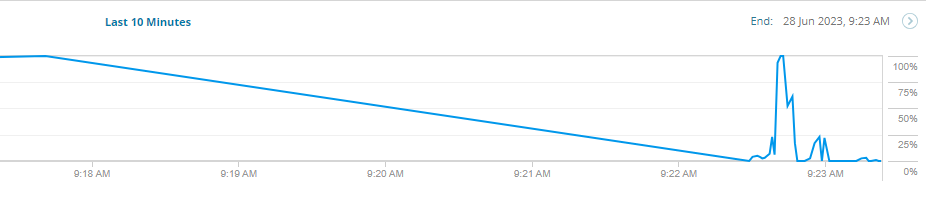
Starting RTP:
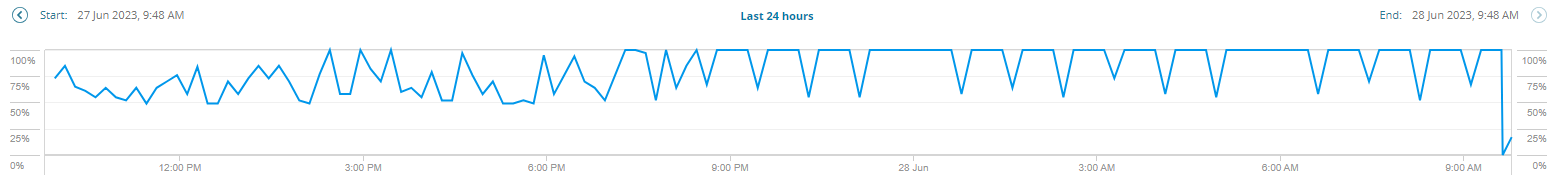
24Hrs SW:
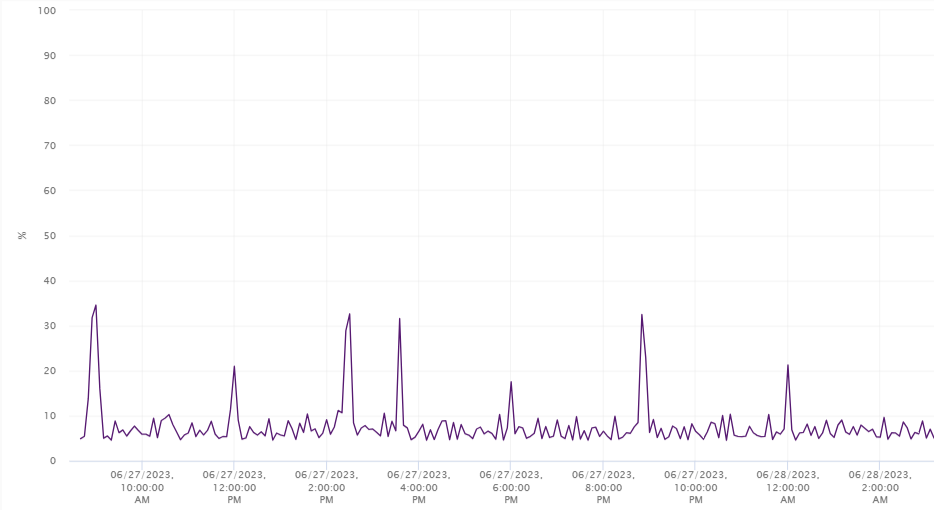
24Hrs vSpere: