Hi all,
I am trying to monitor Jira's live performance using the SolarWinds SAM module. SolarWinds SAM supports JMX monitoring. I configured Jira according to this document Monitor application performance | Administering Jira applications Data Center and Server 9.9 | Atlassian Documentation and try to create a custom JMX monitoring using Component Monitoring Wizard. I open a ticket and the support person provided me with this link to follow- Create a custom JMX Monitor in SAM (solarwinds.com).
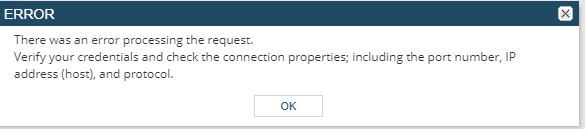
I confirmed that the firewall is open and I am able to monitor using Jconsole. The Jira server is sending data on the port I specified for JMX monitoring. To narrow down the troubleshooting I have disabled SSL and authentication. Whenever I try to run the Component Monitoring Wizard to create a custom monitoring template for JMX monitoring from SolarWinds, I constantly run into an issue. It has something not working right on SolarWinds side, since I can retrieve data from Jira using Jconsole and the same URL path won't work from SolarWinds. Here is the error message SolarWinds returns with.
Any help is appreciated,
Thanks
