Hello forum members,
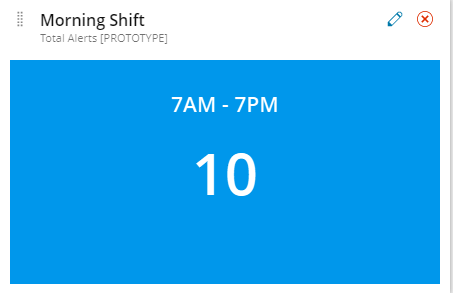
I'm currently working on setting up a Modern Dashboard for our system monitoring, and I'm seeking guidance on creating a KPI (Key Performance Indicator) widget. Specifically, I would like to count the number of alerts with the name pattern "OCC_" that occur between 7 am and 7 pm.
I'm uncertain about the exact steps and configuration required to accomplish this task effectively.
This is my current SWQL query:
SELECT COUNT(*) AS [Total Alerts]
FROM Orion.AlertStatus
JOIN Orion.AlertDefinitions ON AlertStatus.AlertDefID = AlertDefinitions.AlertDefID
WHERE AlertDefinitions.Name LIKE 'OCC_%'
OR AlertDefinitions.Name IS NULL
AND HOUR(TOLOCAL(AlertStatus.TriggerTimeStamp)) >= 7
AND HOUR(TOLOCAL(AlertStatus.TriggerTimeStamp)) < 19
but somehow, it did not accumulate the alert count/triggered between the time period.
If anyone has experience in creating KPI widgets in Modern Dashboards or has suggestions on how to approach this scenario, I would greatly appreciate your insights. Specifically, I would like to know how to define the data source, apply the appropriate filters for the alert name and time range, and generate the count to display as the KPI value.
Thank you for your time and assistance. Your expertise will be invaluable in helping me achieve this goal.
