I recently created a modern dashboard for UPS monitoring, showing some key metrics (battery capacity, input status, uptime remaining, etc.) using the Eaton Powerware UPS Monitoring template I downloaded from Thwack (thanks so much dcharville). I put this in place knowing that some UPS devices had either a warning or critical status based on runtime thresholds.
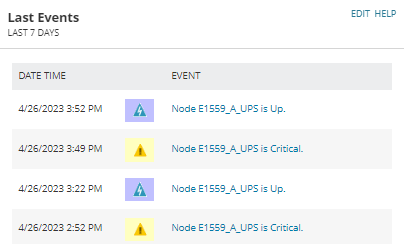
This was all great, but as the dashboard refreshed I noticed at times that the status on all the devices would suddenly go all Green. A few minutes later it would drop back to the appropriate mix of statuses (Up, Warning, Critical) that I was expecting. And I was pretty sure the runtime on all my UPS devices weren't somehow changing during these intervals.
As this seemed odd I checked the Node Child Status Participation settings when the nodes were all showing as UP, and discovered that all the SAM components were missing. And, a few minutes later when the statuses were back to normal, those components were back!
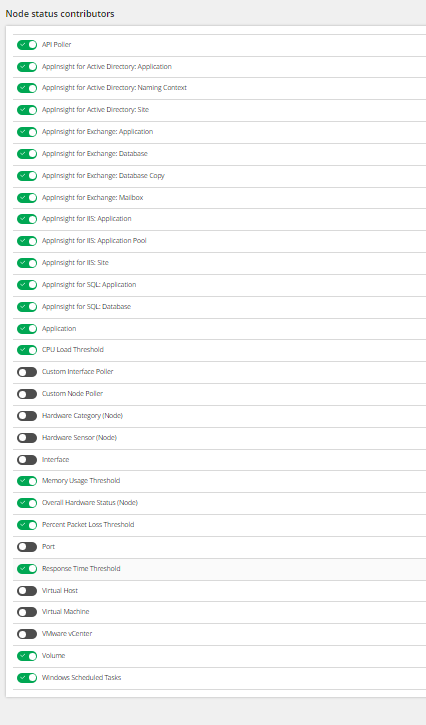 | | 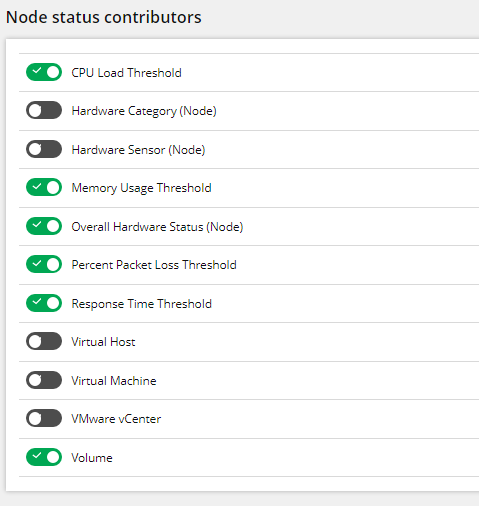 |
| Node status contributors with SAM components | | Node Status Contributors without SAM components |
This seemed odd enough that I opened a ticket on the issue (Support Ticket #01327434) and, naturally, received the usual "it's the database" response. Unfortunately, while I was working through some remediation the VM hosting our main poller was corrupted and rolled back to a (much, much) older state, at which point I had to rebuild the server. The database, fortunately, we unaffected, and once I had the server running everything came back quite well.
Unfortunately this particular issue ended up being worse in the end, and I have now permanently lost the SAM components in terms of the status roll-up. While SAM is still functioning and I can see the status of individual applications and components, the status of those pieces are no longer rolling up to the nodes themselves, and are therefore not generating alerts. Alerts based directly on the application and component status continue to work fine. I re-opened the case (as it had been closed while I attempted to recover the VM), but so far I've only got the usual "We ran your original diagnostics package through the 'best practices' analyzer, and here's what it spit out" response from support. This, unfortunately, seems to be the new normal.
So, if anyone has seen something like this before, or has a suggestion, I'd be happy to hear it. We are currently running v2022.4.1 with a selection of modules (NPM, SAM, NCM, UDT, IPAM, VMAN, VNQM). While I am anxious to move to 2023.2, with all its bug fixes, I'd like to get this resolved before we move forward with an upgrade.
Thanks.