Hi
is it possible to create a report that will show the interface utilization trend for a certain period of time, say 1 month, 3 months or 6 month?
I am talking about a graphical report, not a data one.
Cheers in advance
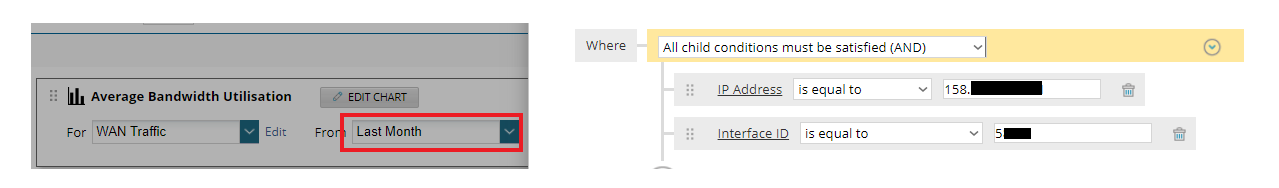
OOB I don't think there is but they are easy enough to create.Here's a screenshot of one of ours ... the logic on the right show when you click edit next to what we called WAN Traffic. You simply need to add in your appropriate arguments.
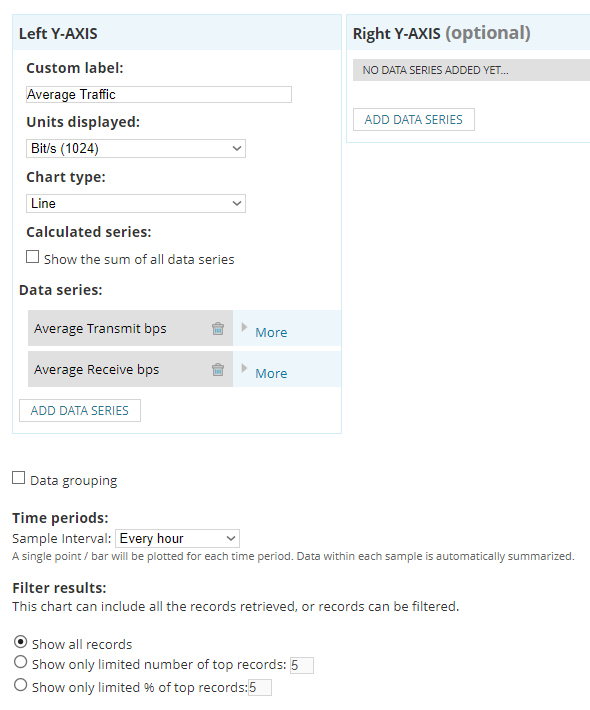
Then in the Red boxed bit select your timescale from one of the default options or go with custom at the bottom. Then click on Edit Chart, add your 'data series' as desired, set what you need and preview:
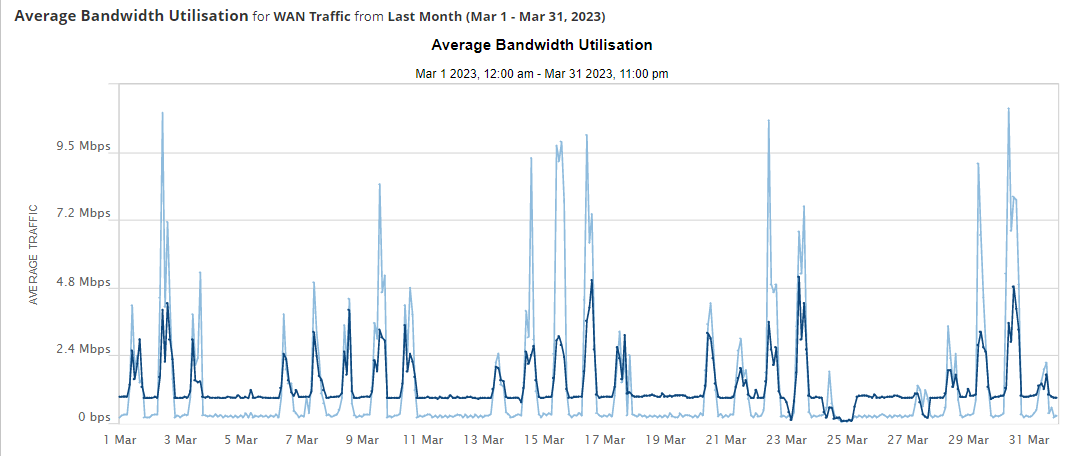
Ours looks like: