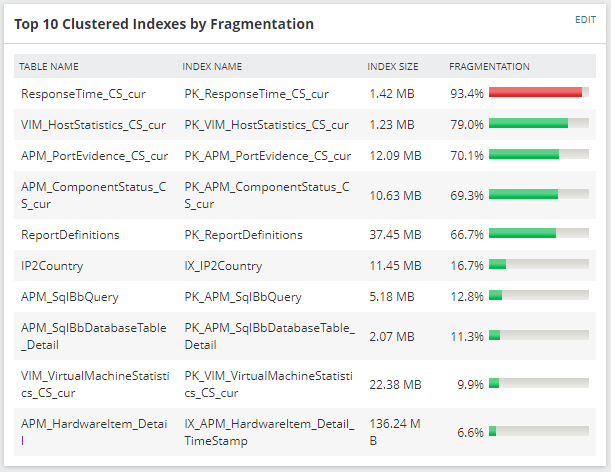
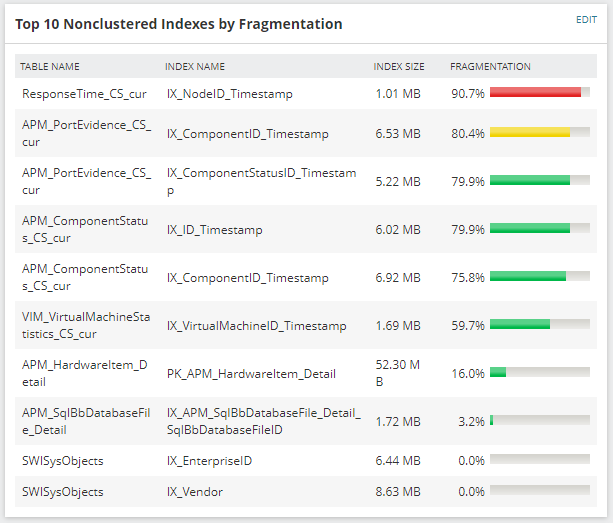
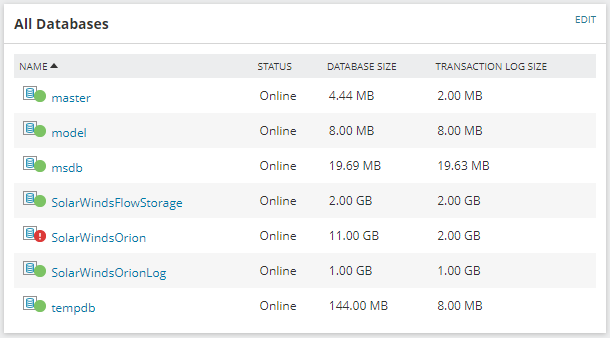
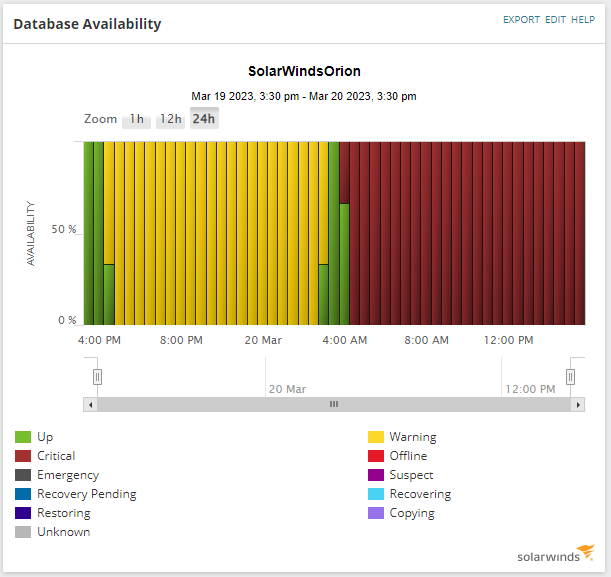
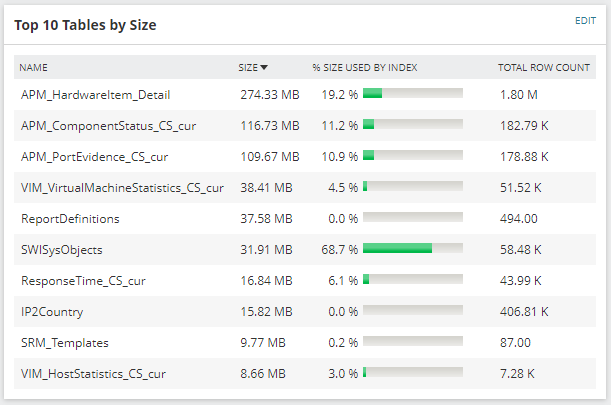
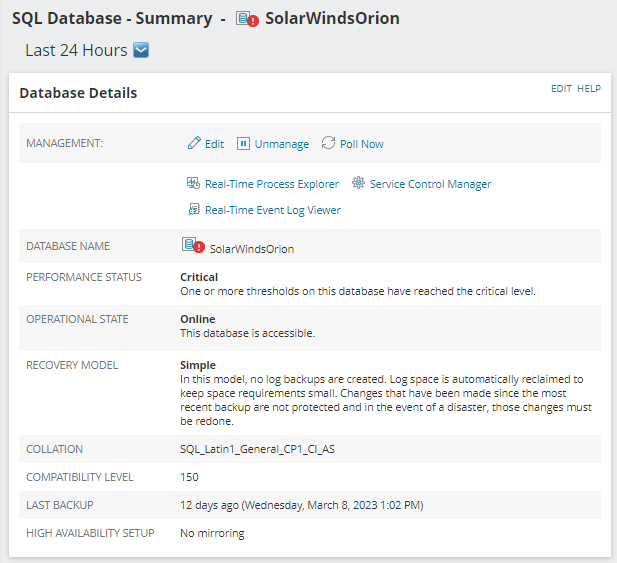
New job as of 2 weeks ago. New SolarWinds install (NPM, SAM). Barely monitoring anything as I am getting up to speed: a vCenter with a base ("free") VMAN with 30 hosts and <200 VMs, a few VMs and physical hosts. Yet Orion is "critical" in SQL AppInsight: ResponseTime_CS_cur table and its PK_ResponseTime_CS_cur and IX_NodeID_Timestamp indices have >90% fragmentation.
ResponseTime_CS_cur table
PK_ResponseTime_CS_cur
IX_NodeID_Timestamp
Database Manager and Active Diagnostics don't seem to catch anything or suggest any fixes.
There's a lot to catch up to, and to tune in terms of best practices for Orion and SQL performance - yet wanted to see if there's any tribal knowledge of what to do with that fragmentation.
Some additional info:
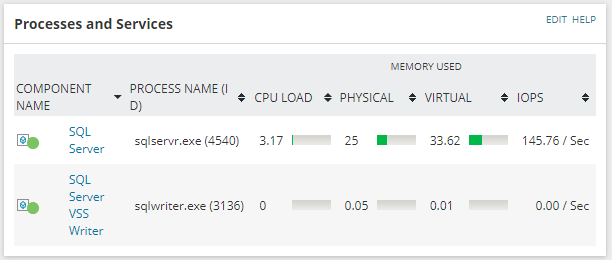
Orion and the SQL Server are on the same host (Windows Server 2019 VM, SQL Server 2019, 16GB RAM, 8 cores).
Help? Thanks!
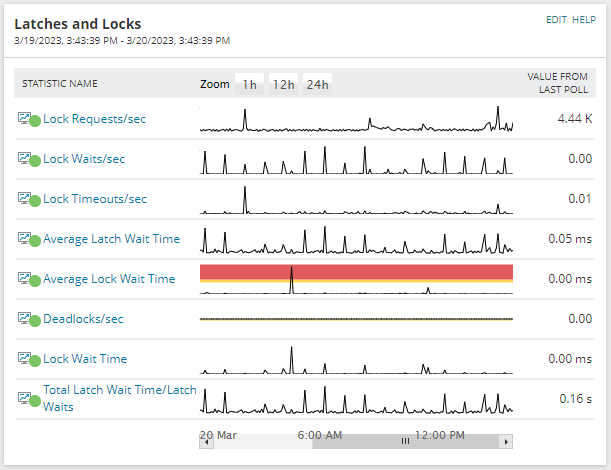
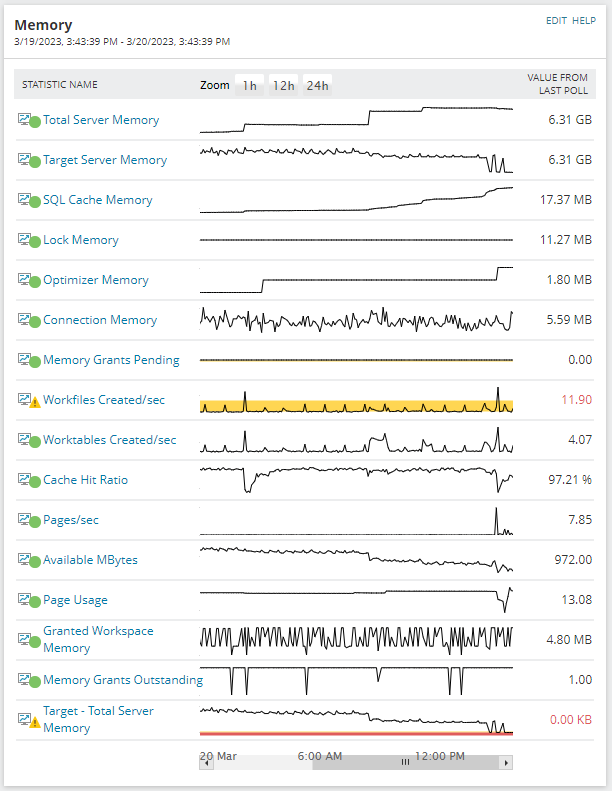
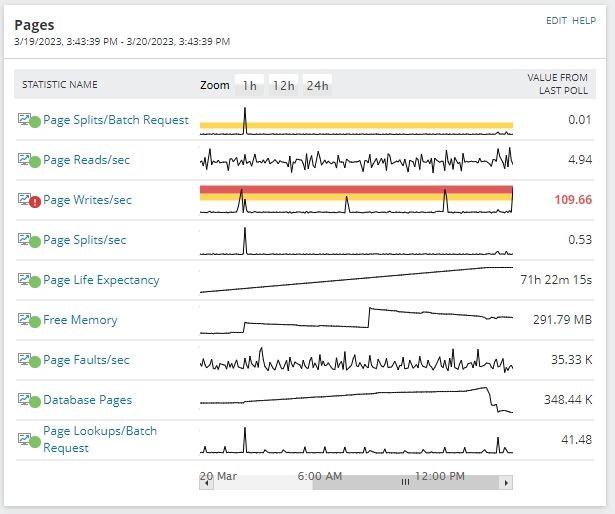
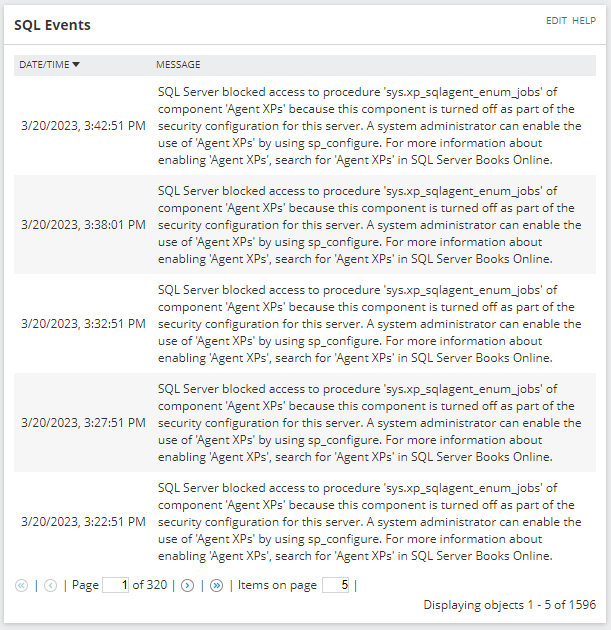
P.S. The rapid fragmentation of these indices seems odd (not a DBA and know very little about why it would happen - yet don't remember this happening on much busier NPM/SAM instances). Also odd: