Hi Guys,
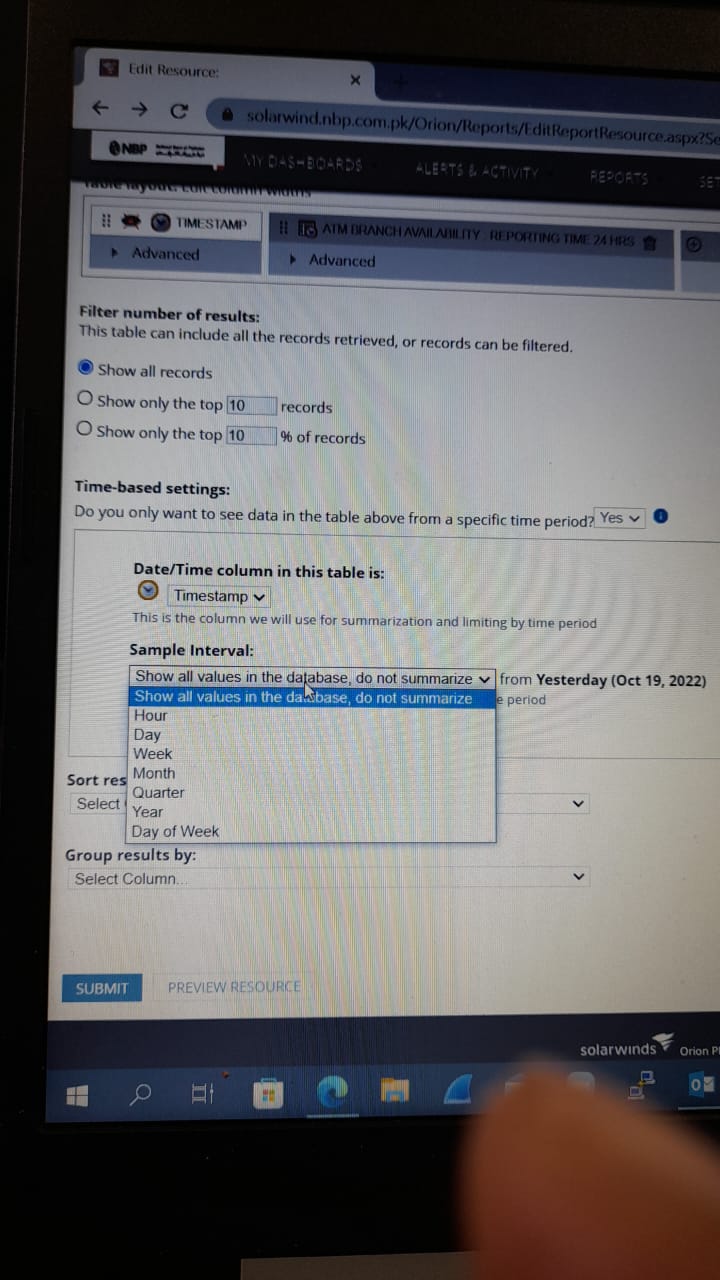
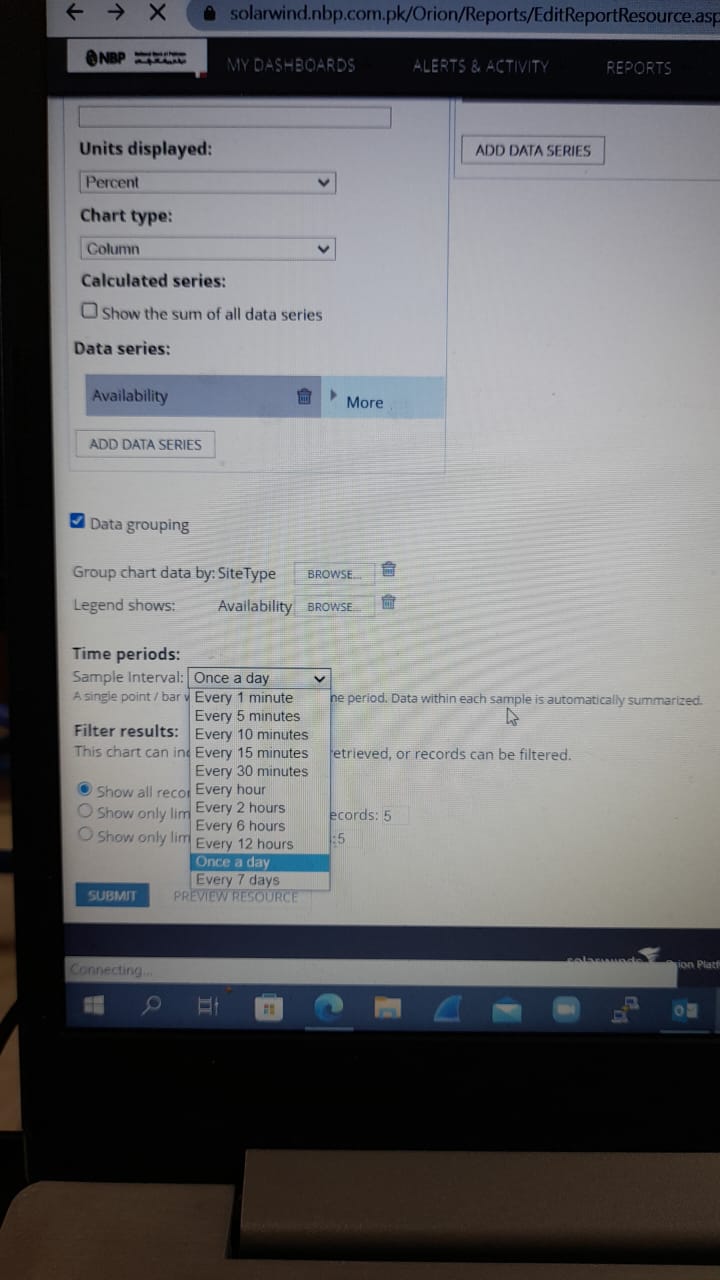
We are making two nodes availability report for core of yesterday, one is for management in chat i.e. graph format and other one in table format .We are using same data which is availability, but the out come is differ of each other. I observe the result of table i.e. numerical result is correct but the outcome of graph is differ and not correct.
is there any way to put same sampling interval in chart and table format report as per my finding it may be due to sampling input differ (as attached below ) else other parameters are identical.
Please suggest any solution me in bottle neck in front of higher management reporting.
Thanks