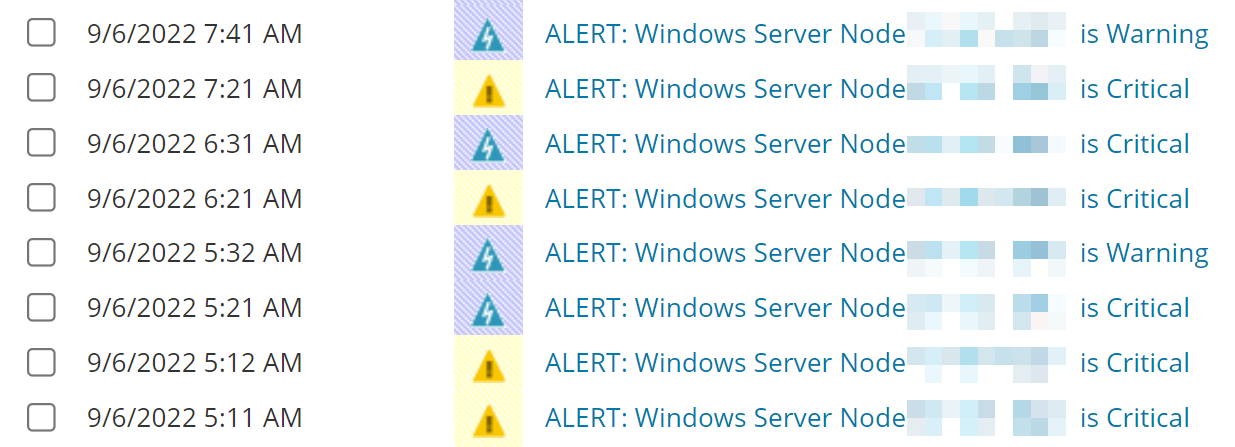
Hi there! Is there a way to make the events in the events tab more descriptive, so I can see at a glance, without hovering over the nodes, what is wrong with it? I have the alerts split up into CPU, memory and disk space, but it seems that this does not transfer to events. See below. This is all the same node, but tells me very little as to what made the node go into Warning and Critical state at the time.