I am working on a report using Node Downtime History fields and the output makes no sense. Every Final Datetime value is also seen as the Start Datetime value for the next outage event.
How is this possible?
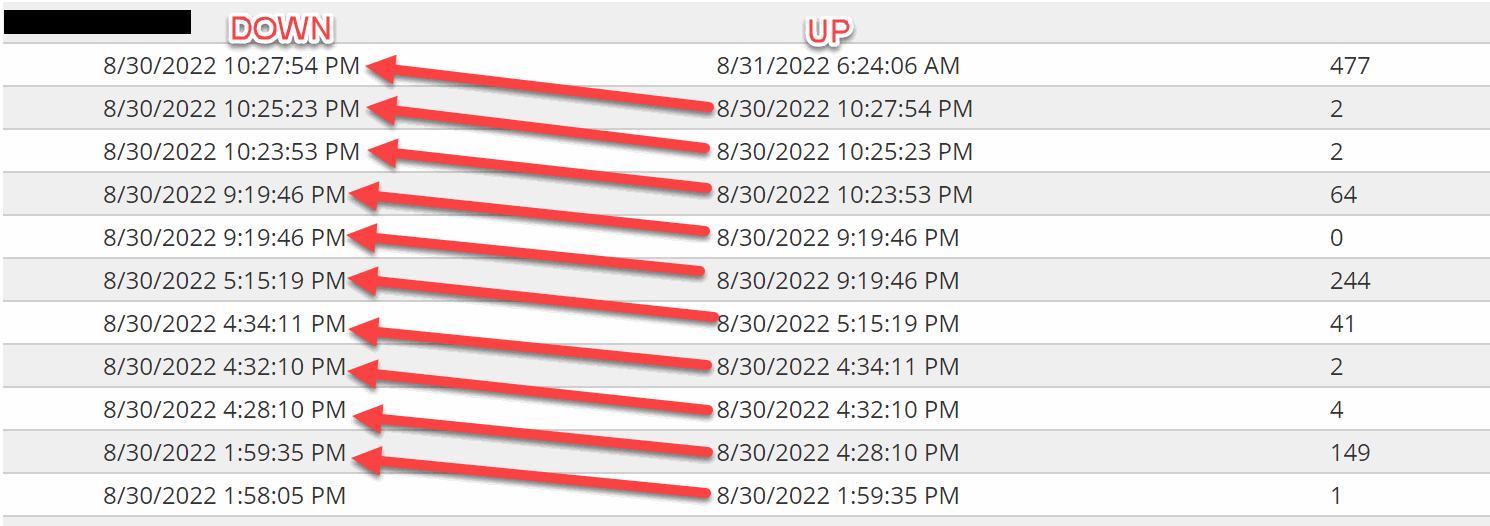
Update based on a test I ran on one node. I manually created two separate down events for the node in the screenshot below. One event lasted from 11:54 Am to 12:03 PM, or approx. 9 minutes, the second event started when I took the node down at 12:14 PM and ended when the node came back up at 1:08PM. In case it may be important, the status poling interval is 60 secs and the node warning level is set to 30 secs. Any thoughts on why there are so many events, and again, why is the UP event time stamp also showing as the next Down event timestamp when there are periods of up time between down events? Love to solve this one sine this report is greatly needed by management. Thanks.
Perhaps I should also ask for the exact definitions of the "Start Datetime" and "Final Datetime". I would assume that the Start Datetime is the time the node went into DOWN status. The Final Datetime would then be when the node is back UP. Could either of them be something else? I ask because of all of the "extra" events in the report that do not correspond to an actual status change.
Another example where the report is showing too many "events". As you can see, there was a down event at 10:13 and an Up event at 10:58. The 2 minute "event" between 10:11 and 10:13 did not happen, and why is the runtime stamp for the report being interpreted as an Up event? It seems that the query is catching other event types than just Node Down and Node Up. Need to fix this. Ideas?
I'm not sure what the Node Downtime History fields you're referencing are but I've been meaning to play around with this report by @stevenstadel at some point.Maybe it might point you to what you're after.
thwack.solarwinds.com/.../298845