I was helping someone elsewhere and thought I should share this here.
SELECT [Metrics].ValueToMonitor.ApiPoller.Node.DisplayName AS [Node Name]
     , [Metrics].ValueToMonitor.ApiPoller.Node.DetailsUrl AS [Node Name_Link]
     , [Metrics].ValueToMonitor.ApiPoller.DisplayName AS [Poller Name]
     , [Metrics].ValueToMonitor.ApiPoller.DetailsUrl AS [Poller Name_Link]
     , [Metrics].ValueToMonitor.DisplayName AS [Metric Name]
     , [Metrics].ValueToMonitor.DetailsUrl AS [Metric Name_Link]
     , AVG([Metrics].AvgMetric * 1.0) AS [Average (Last 24 Hours)]
     , MIN([Metrics].MinMetric * 1.0) AS [Minimum (Last 24 Hours)]
     , MAX([Metrics].MaxMetric * 1.0) AS [Maximum (Last 24 Hours)]
     , [Metrics].Status AS [Current Status]
FROM Orion.APIPoller.ValueToMonitor.Metrics AS [Metrics]
-- The above is just too big, so only give me the last 1 day
WHERE [Metrics].ObservationTimestamp >= GETUTCDATE() - 1 -- "right-now" minum 1 (day)
-- Filter for a specific API Poller by name
-- AND [Metrics].ValueToMonitor.ApiPoller.DisplayName = 'Pi-Hole Status'
-- Filter for a specific API Poller Metric by name match
-- AND [Metrics].ValueToMonitor.DisplayName LIKE 'Query%'
GROUP BY [Metrics].ValueToMonitor.ApiPoller.Node.DisplayName
       , [Metrics].ValueToMonitor.ApiPoller.Node.DetailsUrl
       , [Metrics].ValueToMonitor.ApiPoller.DisplayName
       , [Metrics].ValueToMonitor.ApiPoller.DetailsUrl
       , [Metrics].ValueToMonitor.DisplayName
       , [Metrics].ValueToMonitor.DetailsUrl
       , [Metrics].Status
ORDER BY [Metrics].ValueToMonitor.ApiPoller.Node.DisplayName
       , [Metrics].ValueToMonitor.ApiPoller.DisplayName
       , [Metrics].ValueToMonitor.DisplayName
This query connects the metric to the API poller, and then back to the assigned node. I used this example to build a very simple modern dashboard.
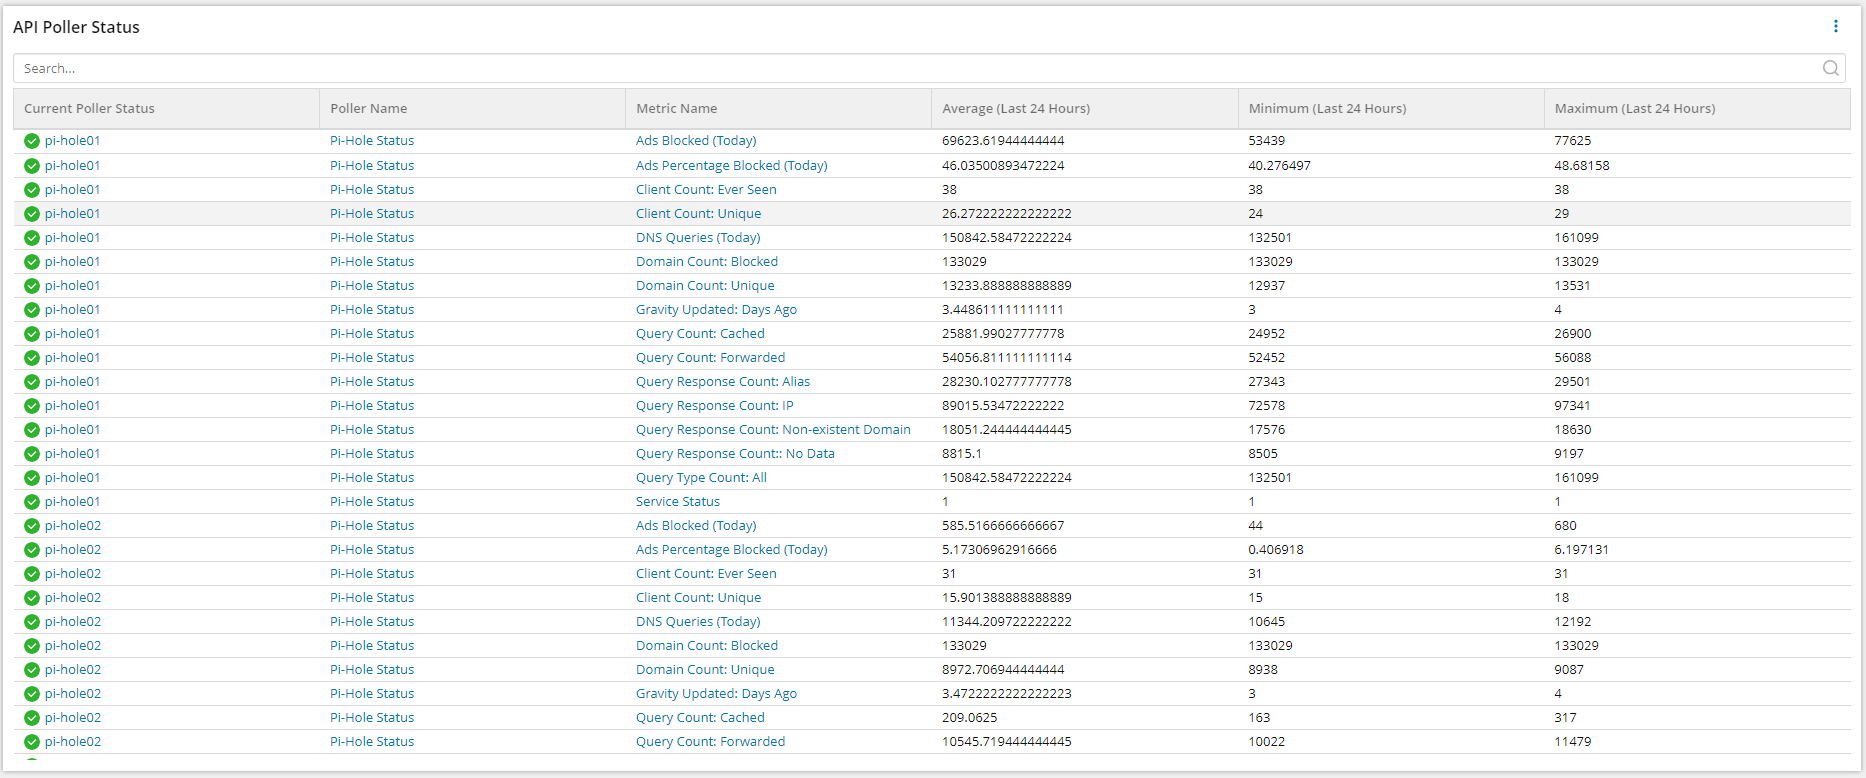
In my environment, I only have the one poller setup, so that's all it returns. I left a bunch of comments in the above to provide some other ways to filter it. I'm happy to answer questions.