Hi all
I'm trying to wrap my head around a problem similar ot this:
thwack.solarwinds.com/.../216922
Our goal is to have:
A) a web based report covering all EIGRP speaking nodes (250+ nodes), showing their current total Eigrp Neighbor Count and some info if the value is as expected or lower. The nodes run between 1 an 5 VRFs with 2 EIGRP neighbors each.
") to raise an alert when a Node's total number of EIGRP neighbors drops to 0 and stays 0 for more than 15min or 30min.
to raise an alert when a Node's total number of EIGRP neighbors drops to 0 and stays 0 for more than 15min or 30min.
With a custom poller (type GET TABLE) the EIGRP neighbor count can be pulled as a table from 1.3.6.1.4.1.9.9.449.1.2.1.1.2, like this
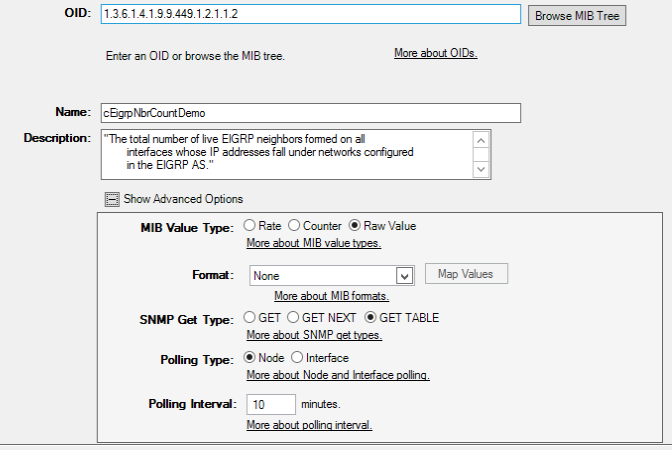
... delivering a table for each routing instance resp VRF, including 1 for the Global Routing Table
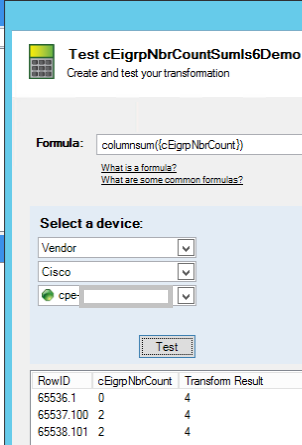
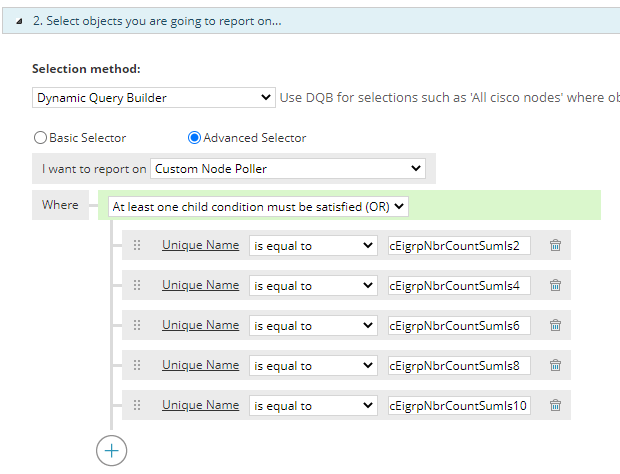
Since it is the sum we're interested in, the idea was to define a transform to return the columnsum for each node. I configured each a transform set for the expected number of EIGRP neighbors (2,4,6,8 or 10), and assigned a warning and critical threshold to each of these custom pollers.
So far so good, seems to work, at leas somewhat. Cisco's IOS SNMP Agent seems to increment the instance numbers from 64k up, and adds the EIGRP AS number as index, with 1 always being the GRT, and the other number being the given EIGRP AS number. While the instance numbers seem to be somewhat predictable (icnrements of 1 per VRF), the AS numbers are arbitrarily chosen by the admin setting up the given customer, and they may even overlap between customers.
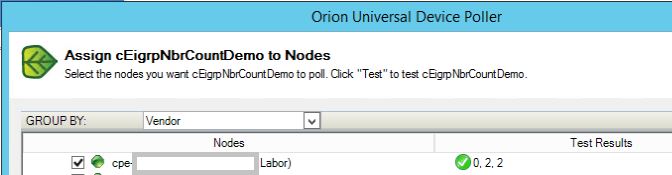
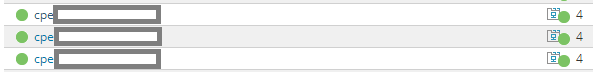
Now when I try ro run a web based report on for my transform cEigrpNbrCountSumIs6Demo (or any other of these transforms), this happens: the given line sometimes is shown multiple times (exactly 1 times plus 1x per VRF). The watermark icon reflects the transformed custom poller's status correctly, as per the threshold values for the given transformed poller.
The report/datasource is defined like this:
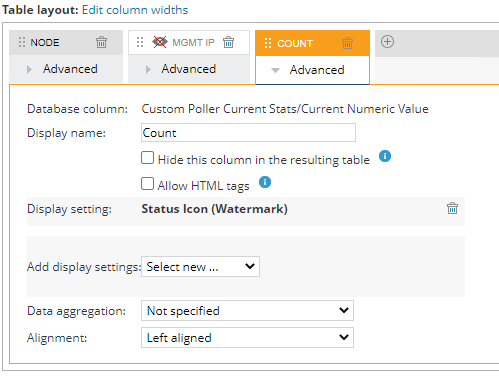
And the table is defined as
There is two problems with this report
- Unpredictably, there's n lines per node (1 per routing instance). This changes over time. At one time, there's one line, other times therese n lines per node (or: per custom poller). It seems that re-running the report after on-demand-polling the node makes multiple lines appear, but so far, I havent' been able to spot a pattern.
I can do Data aggregation in the table ("Max"), then the report table only gets a single line per Node (resp. per transformed custom poller)
Having multiple lines in the report is no problem, if it weren' for the next point
- The values are sometimes correct, However, they don't pick up all changes, even hours after EIGRP neigbors were deliberatly taken down.
This is especially bad for requirement (see above) - when I want to see an alert for a Node, when its EIGRP Nbr Count has been 0 for more than 15 or 30 minutes,
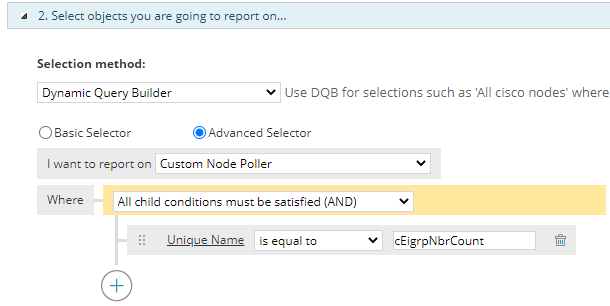
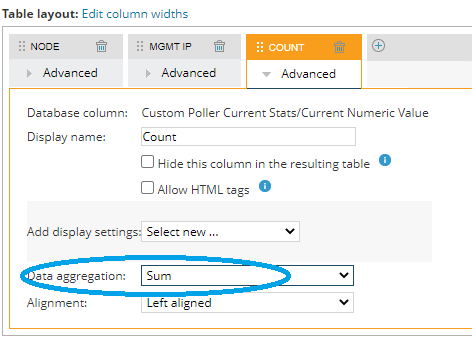
Interestingly, when I run a web based report directly on the un-transformed custom poller cEigrpNbrCount (see above), and I let the report do the Data Aggergation ("Sum"), the values are perfectly correct, and they appear well within the expected timeframe.
But this way, there is no simple way to get something like a water mark, nor can I do alarms on cEigrpNbrCount, as it seems that Alarms can't do "Sum".

Note:
We do "natively" collect EIGRP information with NPM from these nodes, and we do get NPM events for them a Neighbor goes down. But that's just the event, and Nbrs come and go, We need to be able to check the current (sum) value (--> report) and be alerted iif it stays 0 for too long. (--> alert).
Where do I start digging?
- Collect something else than cEirgrpNbrCount?
- find the total neighbor count in EIGRP information collected by NPM anyway? There seems to be a wealth of EIGRP relatied information in there, but I can't seem to find Neighbor Count.
- Transforms not being calculated correctly/on time? Check timers, depenencies? How?
- look at some SQL magic to pull the info collected from custom Poller cEigrpNbrCount instead of a Transform with columnSum()
Thanks for your hints and pointers
Marc
