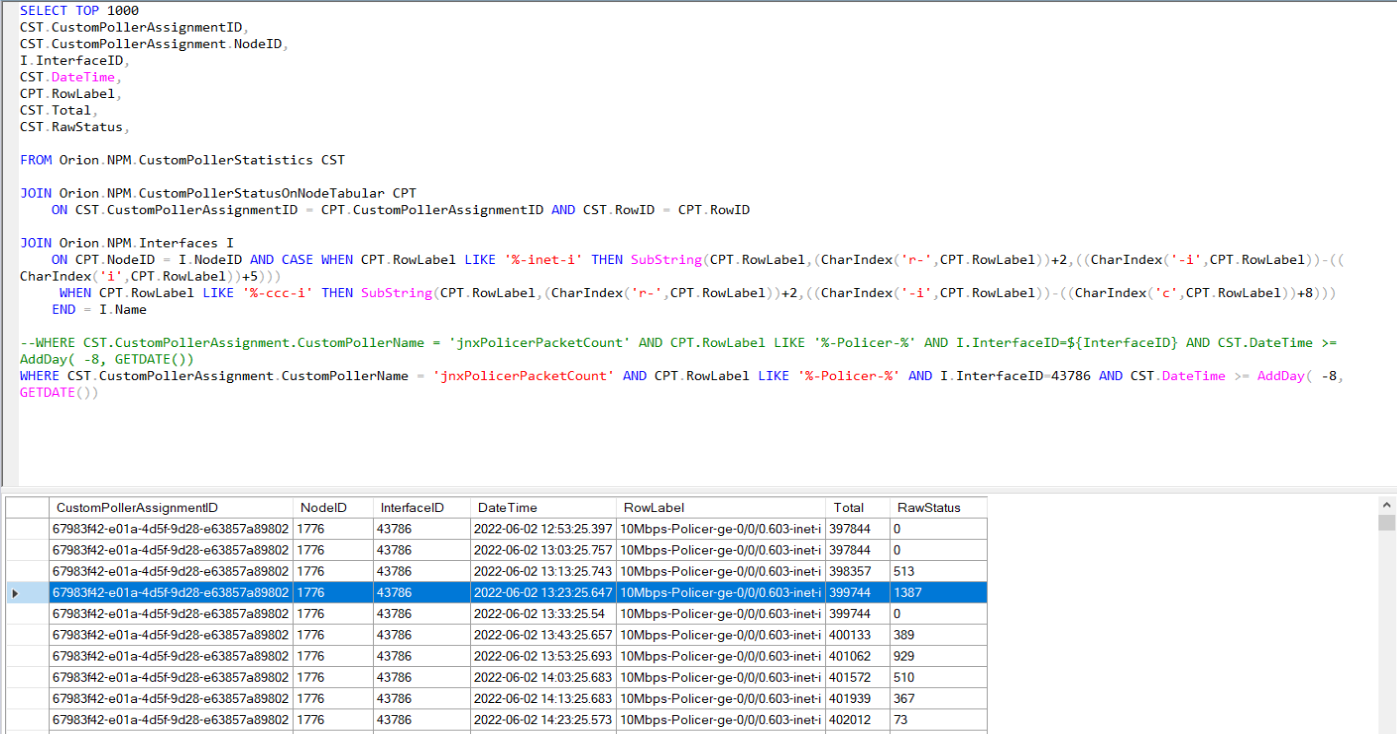
I would like create a graph that shows a percentage of dropped packets but I'm having trouble figuring out how I would join the custom poller poll time per row to the Orion.NPM.InterfaceTraffic table DateTime for InTotalPkts. My thought was I could do (CST.RawStatus / IT.InTotalPkts) * 100 and get a percentage. CST.RawStatus being a custom poller for Juniper policer packets being dropped and dividing that by Total Rx packets for that interface.
I'm not sure how I can get those values to be joined so the calculation is done for the values taken during the same time frame though.
For example below the custom poller DateTime is 2022-06-02 13:23:25.647
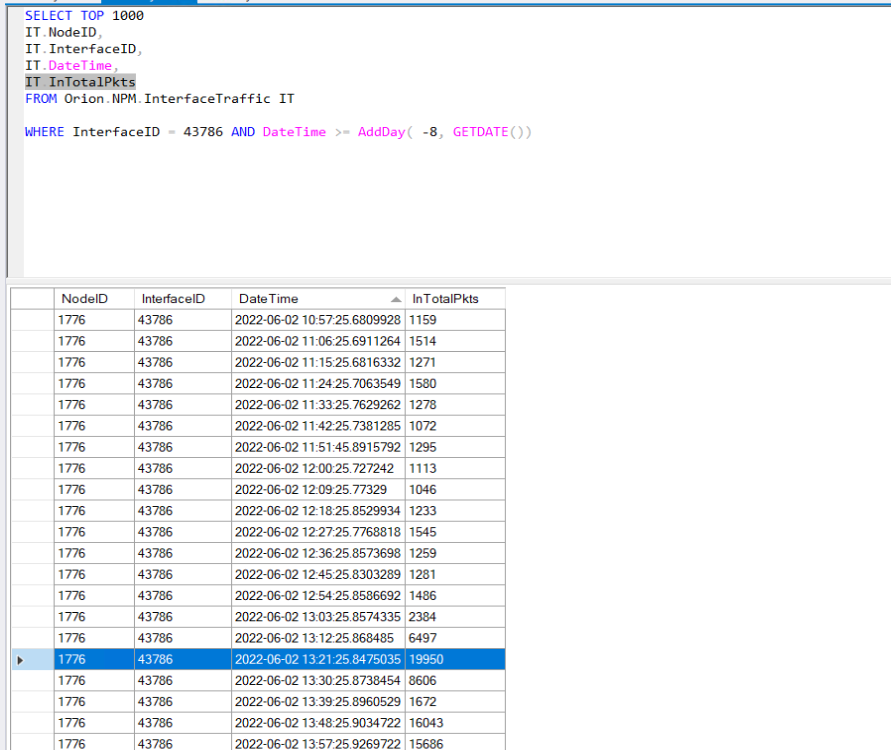
And here in the InterfaceTraffic table the closest poll time is 2022-06-02 13:21:25.8475035
Any idea how to do this? Right now I'm just graphing the dropped packets but it would nice to visualize what the actual impact is with a comparison to total packets.