OK so I have certain servers (SQL being one of them) where I have changed the threshold limits on.
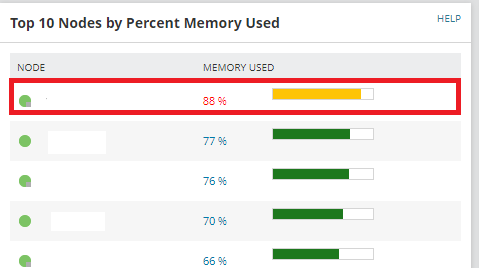
Now my query lies around the default top 10 dashboards, it shows anything that exceeds the 80% limits as yellow line graph and 90% red line graph.
However the SQL servers I only want to show them as yellow at 90% and red at 95% for example.
I have got this SWQL so far but need further assistance;
SELECT [Nodes].Caption
, '/Orion/images/StatusIcons/Small-' + [Nodes].StatusIcon AS [_IconFor_Caption]
, [Nodes].PercentMemoryUsed
, [Nodes].DetailsUrl AS [_LinkFor_Caption]
FROM Orion.Nodes AS [Nodes]
WHERE PercentMemoryUsed > 80
ORDER BY [Nodes].PercentMemoryUsed DESC