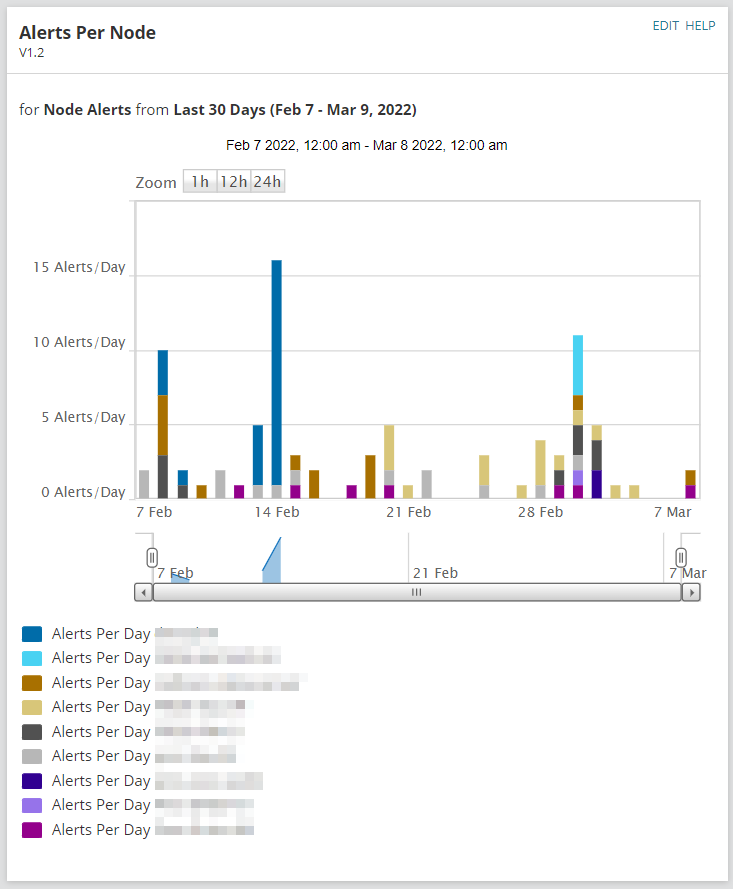
I'd like to see the count of triggered alerts over time in a bar chart, ideally grouped by alert severity.
There might be something for this out of the box, but I have not come across it.
I don't have experience with the custom charts, but I thought I was close with this query. I appreciate the help!
SELECT AlertHistory.AlertObjects.AlertConfigurations.Severity as Severity, COUNT(*) AS NumberOfAlerts, DATETRUNC('Hour',TimeStamp) as Hour
FROM Orion.AlertHistory
Where EventType = 0
GROUP BY AlertHistory.AlertObjects.AlertConfigurations.Severity, DATETRUNC('Hour',TimeStamp)