Hi Team ,
Solarwinds memory statistics widget shows incorrect memory value .
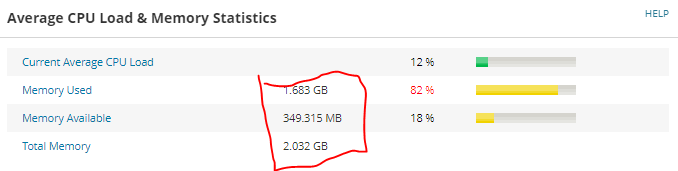
As you can see total memory on the switch is 538MB but Solarwinds shows 2.032 GB .How can we fix this issue ?
Can anyone please advice ?
What is the vendor and model of the switch? Could easily be that the switch IOS needs to be updated. Orion is grabbing the statistics from SNMP. The SNMP OID that it is using may need to be changed for this specific switch. You can do an SNMP walk and compare which OID is being used. CPU and memory utilization Object IDs (OIDs) NPM can poll (solarwinds.com)
Model : Cisco C9200L SOFTWARE VERSION : 17.3.3, RELEASE SOFTWARE (fc7) SOFTWARE IMAGE : CAT9K_LITE_IOSXE
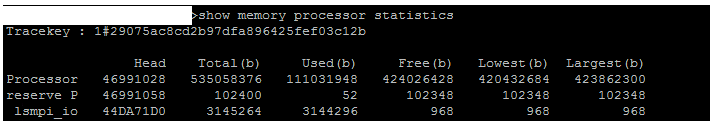
Solarwind is displaying the ROM output ..We should get RAM memory statistics ...
Would be a good idea to open a support ticket at this point. Support will likely want an SNMPwalk Run SolarWinds SNMP Walk to compare. That switch model was specifically supported in the 2020.2 release. Supported vendors and devices added in Orion Platform 2020.2 (solarwinds.com)
How do we check the version on the device ..."show ver | i snmp" does not give version information
Go to C:\Program Files (x86)\SolarWinds\Orion.Run SNMPWalk.exe.Enter the IP address of the node under Agent Address or DNS name.Select Version 2c or 3, depending on the node configured.Enter the community string configured for the device.Scan and save the SNMPWALK file.
Did you get this resolved?If not, you may need to fire up "PollerChecker.exe" which you will find in your c:\program files (x86)\Solarwinds\Orion folder on your primary poller (and APE's if any).Set the polling method to SNMP and Test On to Nodes, then find and tick your device. Be patient if you have a lot of nodes as this tool is not fast. Then in column two tick in memory (or a subset of - in your case just use the ones that start Cisco) and finally click on 'detect pollers'. It may not look like it is doing anything but the word Abort should appear next to the detect pollers button. You will eventually see all the memory pollers that have been tested and a tick against the one your device is currently using.
If the row that's ticked isn't green then you are not using the most optimal. You can view the results of each box by right clicking and 'view details' (it also shows you what OIDs are used), but generally you want to use one that is green. So put a tick next to that one and then click on Add/Replace Pollers.
On our 9200's none of the rows return a green result, so to be accurate we would need to create a custom poller for CPU & Memory. Which has just given me another job to do
I've just created and exported a poller for the Cisco 9200 series - my memory usage on our 3 is now showing correctly.You can see the poller here: https://thwack.solarwinds.com/content-exchange/network-performance-monitor/m/device-pollers/3055 or got to Admin > Custom Pollers and switch to the Thwack tab and search for it (it may take a few minutes to appear).
We have ssigned the correct poller on 9200 switch on Solarwinds server but on Solarwinds tool the statistics still shows incorrect value .
After assigning the poller will the statistics get corrected automatically with sometime? or should we unmanage and re-manage the node ?
In my experience / observations, when I assig a different poller (you may need to check there's only one being used) the 'old' statistics clear and on the next poll it will read the 'new correct' values and start to populate any graphs, etc.If that isn't happening, but under list resources it shows the correct poller in use, but under vital stats it shows the wrong memory use, then you might need to log a ticket.
We have to assign poller from the correct polling device right ...Suppose say we have 3-4 polling engine and on all 4 polling engine I see same poller is assigned ..If I have to change the poller .I can do the change in any polling engine right ?
Can we use the sme poller for 9200 which you have created ? or it will differ ?