Hello,
Is it possible to create a Widget in Modern Dashboards that can show the # of Downs over time for a group of Nodes? It looks like we can only use Perfstack for time charts.
Thanks,
Tom
This should be a relatively simple query. The trick will be filtering for the nodes (are they in a group, share a custom property value, or are the same in some other way) and then connect that with a count of down records in the events entity.). Then all you need too do is filter for the date span you want (last 24 hours, last 7 days, last month, etc.)
Have you checked if anyone has an example in Modern Dashboards (thwack.com/.../dashboards) or Custom Queries (thwack.com/.../queries) as a starting point?
Thank you for your help, I went thru the links you provided but I don't see anything for a chart showing alerts over time. Yep, the nodes I am interested in all start with "AP_" I am just not fluent in SQL/SWQL enough to write a query, and in the Modern Dashboards, It looks like I can only use PerfStack for TimeSeries Widgets and not a custom query like the other widgets.
Thanks again,
Oh, no no no. I use almost exclusively custom SWQL for the widgets. Give me your scenario and I'll see if I can't come up with a query to get you started.
Awesome, thank you very much for your help.
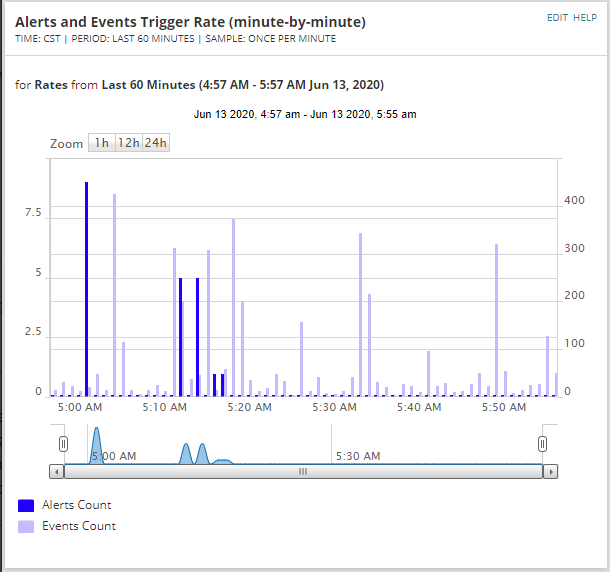
I am looking for a way to create an Alert and Events Trigger Rate chart for the last 60 minutes showing Counts per minute. Also, I need it to be only for Caption like "AP_%"
This is a screenshot I found from another resource but unfortunately, it doesn't work as expected on my side. (1) Alerts and Events Trigger Rate (minute-by-minute) - General IT Topics - Product Forums - THWACK (solarwinds.com)