Greetings fellow geeks!
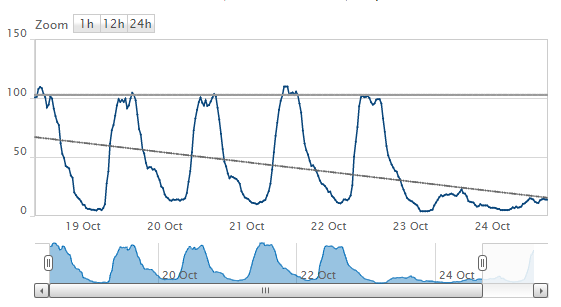
I created a Universal Device Poller to get pull some stats out of one of our firewalls and it shown on a graph like shown below:
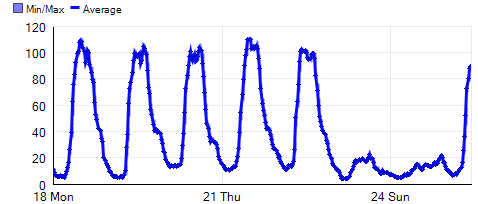
Now I'm trying to create a dashboard with elements from different devices and I tried using a Summary view with a Universal Device Poller Summary resource I get a bit of s static graph like one below.
Is there a way to the get the fancy dynamic graph on a dsahboard?