The %busy values based on the monEngine table for Sybase 15.7 & up especially when running in threaded mode are pretty much useless and tend to be all but constant. A somewhat better metric is to look at the CPU's %idle statistic generated by the OS itself. In order to be as platform independent as possible, the venerable 'sar -u' command can be leveraged on UNIX/Linux platforms to get these data. The downside is that the Extended Procedure (XP) server must be configured but that is trivially easy and can be added 'on the fly'.
Step 1:
If you need to add an XP server then create an additional entry in your interfaces file with a different port number and the entry name should be indentical to the dataserver's entry will "_XP" appended. For example, assume that you have a dataserver named DEVSYBXXX
DEVSYBXXX
master tcp ether sybdevxxx.socogen.com 8985
query tcp ether sybdevxxx.socogen.com 8985
DEVSYBXXX_back
master tcp ether sybdevxxx.socogen.com 8986
query tcp ether sybdevxxx.socogen.com 8986
#Add a new entry to the file something like this:
DEVSYBXXX_XP
master tcp ether sybdevxxx.socogen.com 8987
query tcp ether sybdevxxx.socogen.com 8987
Now using isql execute the following:
USE master
go
sp_addserver "DEVSYBXXX_XP", NULL, "DEVSYBXXX_XP"
go
--- You will probably need to run the following so that external commands run as the dataserver owner, e.g. Sybase
sp_configure "xp_cmdshell context", 0
go
There is no need to create run / stop scripts for the XP server as it is automatically invoked the first time xp_cmdshell is invoked.
Step 2. Install the following script in a convenient location, e.g. /usr/local/bin/cpubusy.sh
#!/bin/ksh
typeset VRSN='[1.0 ]'
# 1.0 10/19/2017 acs - Call to sar for Sybase CPU %busy for Ignite
# Parses output of sar -u looking for %idle field
typeset PROG=${0##*/}
typeset -i SAMPLE_TIME=5 # sar sampling period; suggest at least 5
PATH="/usr/bin:/bin://usr/local/bin:$PATH}"
export PATH
# -----------------------------------------------------------------
function Bld_A1
{
typeset -i xSTAT=0
echo "BEGIN {"
echo "stat = 100"
echo "i = 1"
echo "fnd = 0"
echo "}"
echo "{"
echo " if (fnd == 0)"
echo " {"
echo " i = 1"
echo " while ((i <= NF) && (fnd == 0))"
echo " {"
echo " if (tolower(\$i) ~ \"^%idle\") fnd = 1"
echo " else ++i"
echo " }"
echo " }"
echo " else"
echo " {"
echo " stat = 0"
echo ' printf("%.0f",(100.0 - $i))'
echo " exit(stat)"
echo " }"
echo "}"
echo "END {"
echo "exit(stat)"
echo "}"
return ${xSTAT}
} # Bld_A1
# -----------------------------------------------------------------
# If nawk is in PATH use it rather than awk (oawk).
# Function does the evaluation only first time.
# Hack for Solaris
typeset AWKEXE=""
function AWK
{
if [[ -z "${AWKEXE}" ]]
then
typeset DUMMY=""
typeset -i ASTAT=0
DUMMY=$(type nawk 2>/dev/null)
ASTAT=${?}
if [[ ${ASTAT} -eq 0 ]]
then
AWKEXE=nawk
else
AWKEXE=awk
fi
fi
echo "${AWKEXE}"
return 0
} # AWK
# -----------------------------------------------------------------
typeset -i STAT=0
typeset OUT="100"
typeset A1=""
PATH="/usr/bin:/bin:/usr/local/bin:${PATH}"
export PATH
A1="$(Bld_A1)"
OUT=$(sar -u ${SAMPLE_TIME} 1 | $(AWK) "${A1}")
STAT=${?}
echo "${OUT}"
exit ${STAT}
Save the file and make it executable.
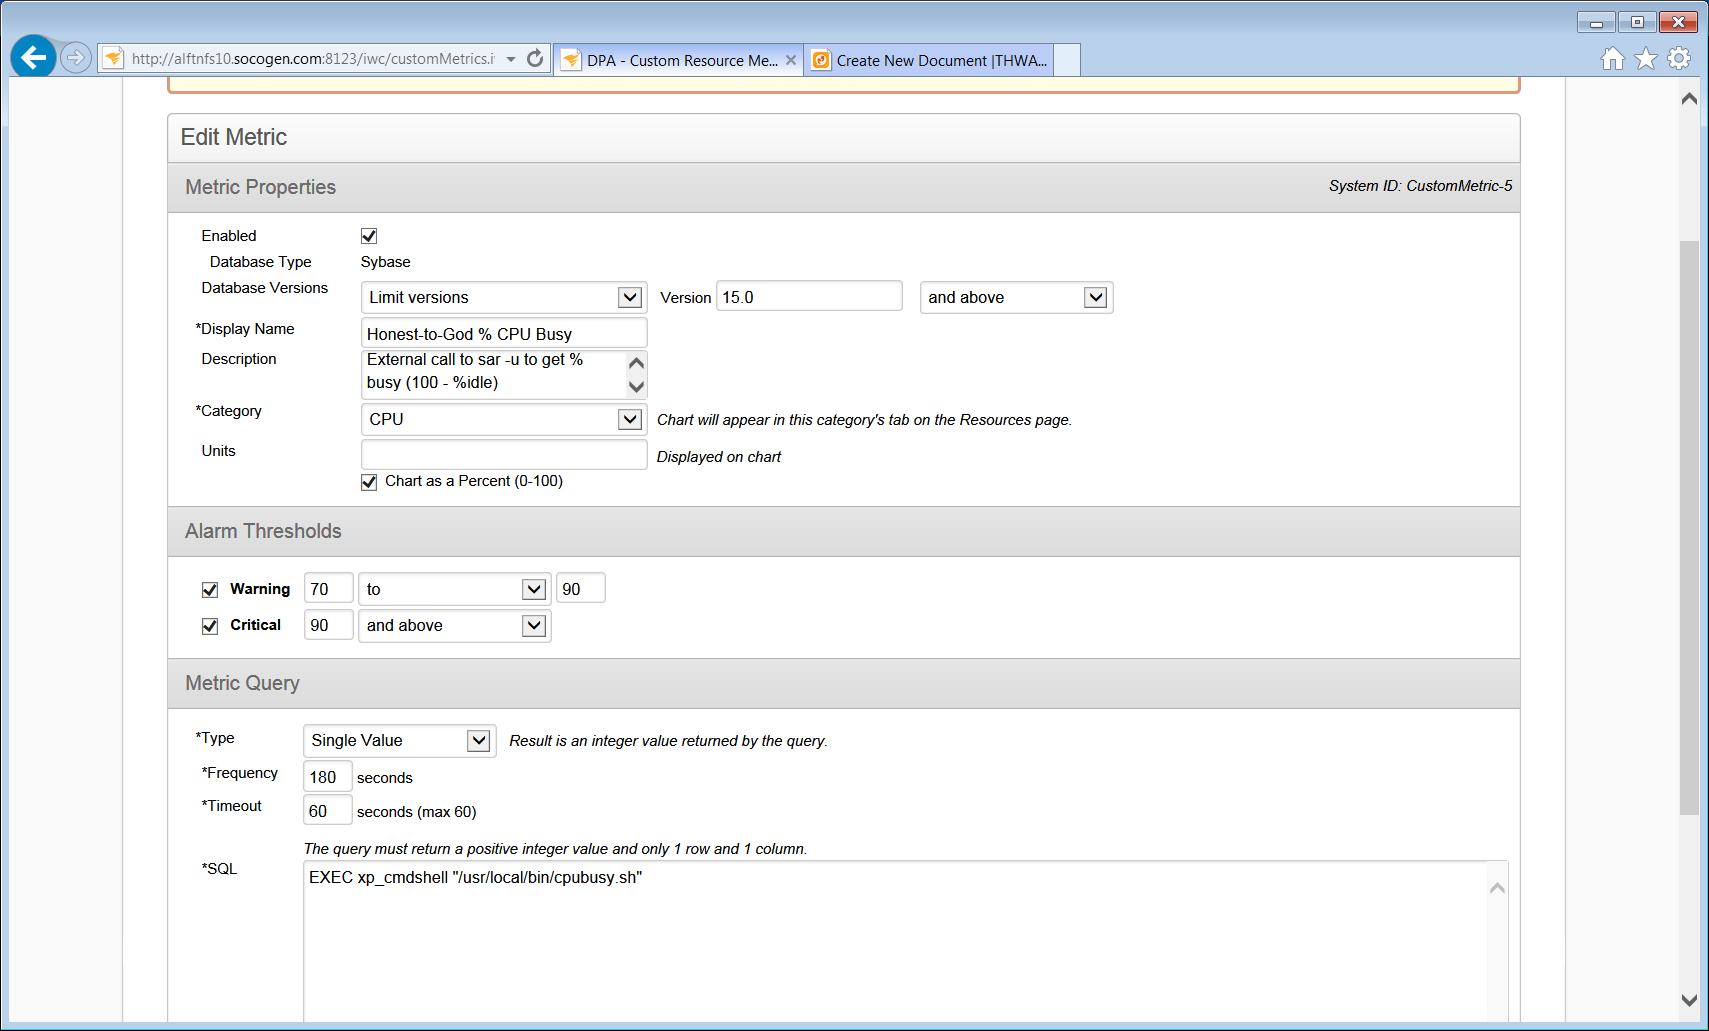
Step 3. Create a custom metric.