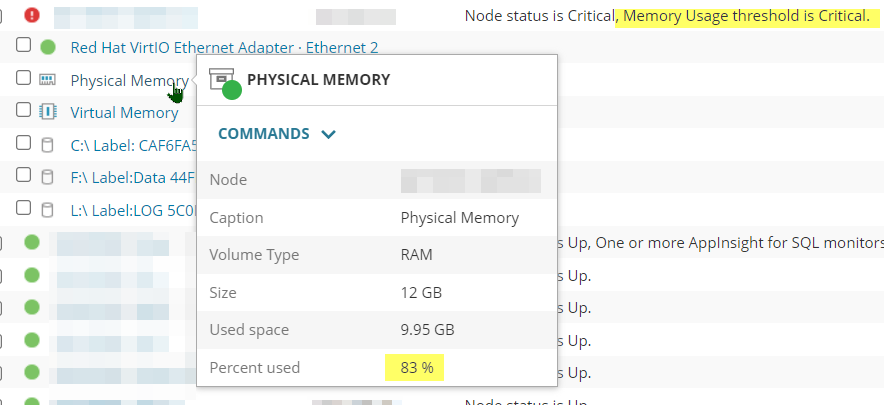
A (passive agent connected) Windows 2019 node with 80-83% memory used (according to the OS and the physical memory resource of the node) is the source of the alert "Node is in a Critical State": Node -> Vital stats: 95% memory used.
BUT: Any other details shows the correct value (see picture). So how can the node report 95% when the physical memory reports the correct 83%?
Virtual memory usage is even lower.
Also the Alarm used is a duplicate of "Node is in a Critical State", with the condition that the condition needs to exist for at least 15min, poll every 1 min and reset when the alert condition is resolved.