01.) Go to Settings -> All Settings -> Manage Alerts and you will see the below menu.
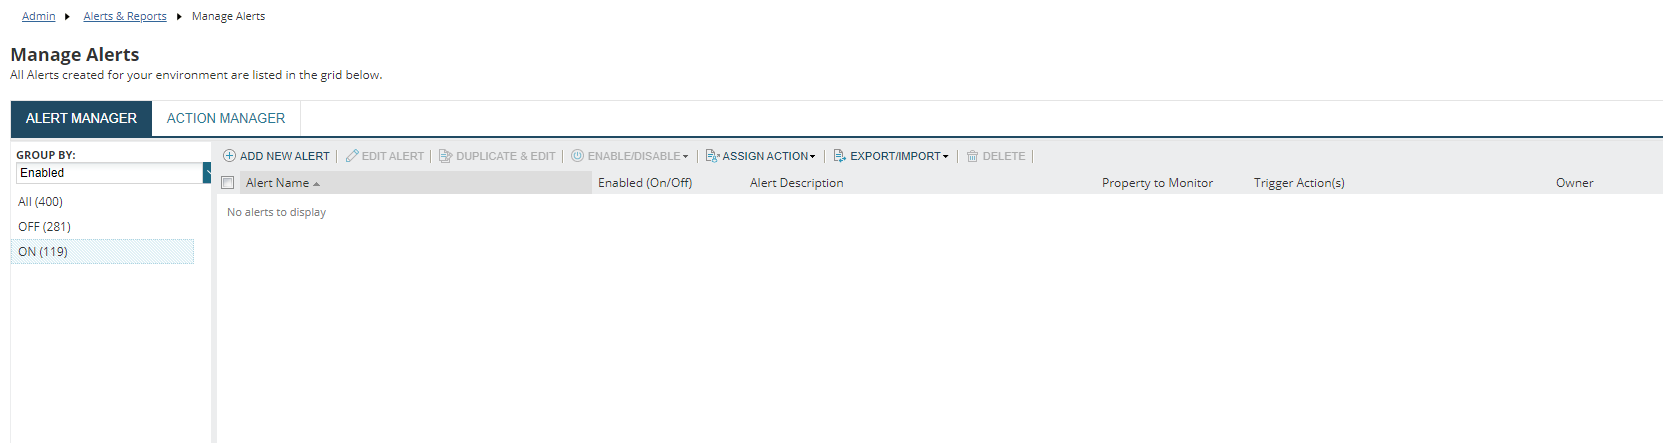
02.) Click on ADD NEW ALERT and configure it as per your requirement. Note that, the default Alerting Interval is 60 seconds. The shortest Alerting Interval is 15 seconds.
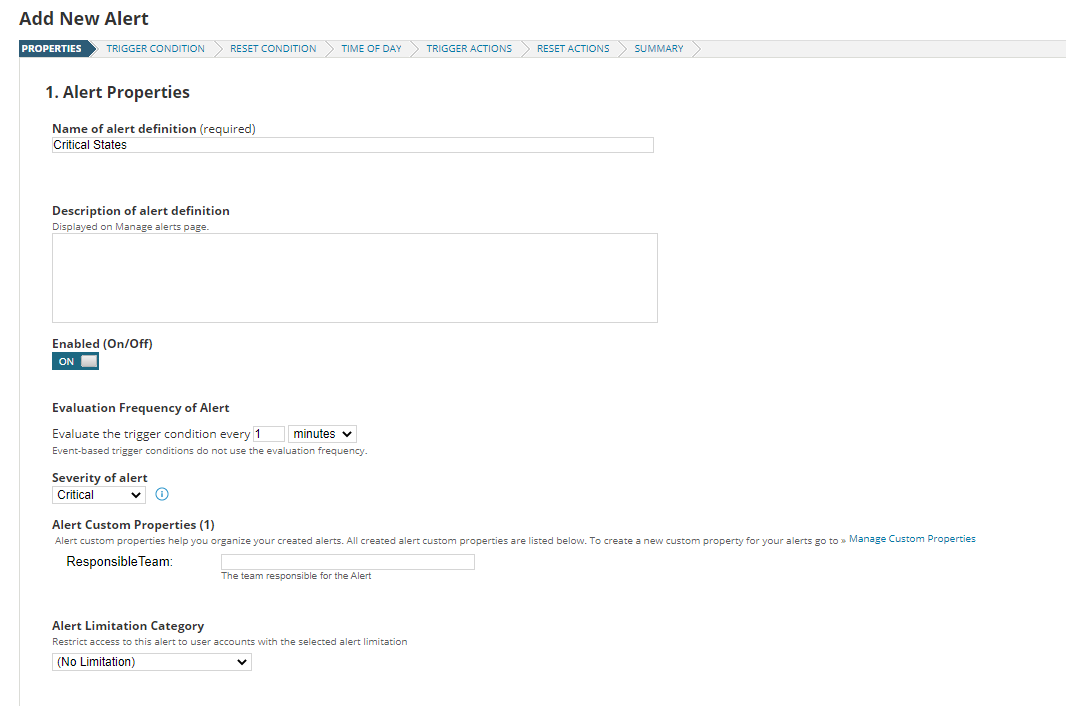
03.) The Alert Engine searches the database to identify "Alert Events" but it does not poll network elements. So, you can't alert on anything that is not already in your database.
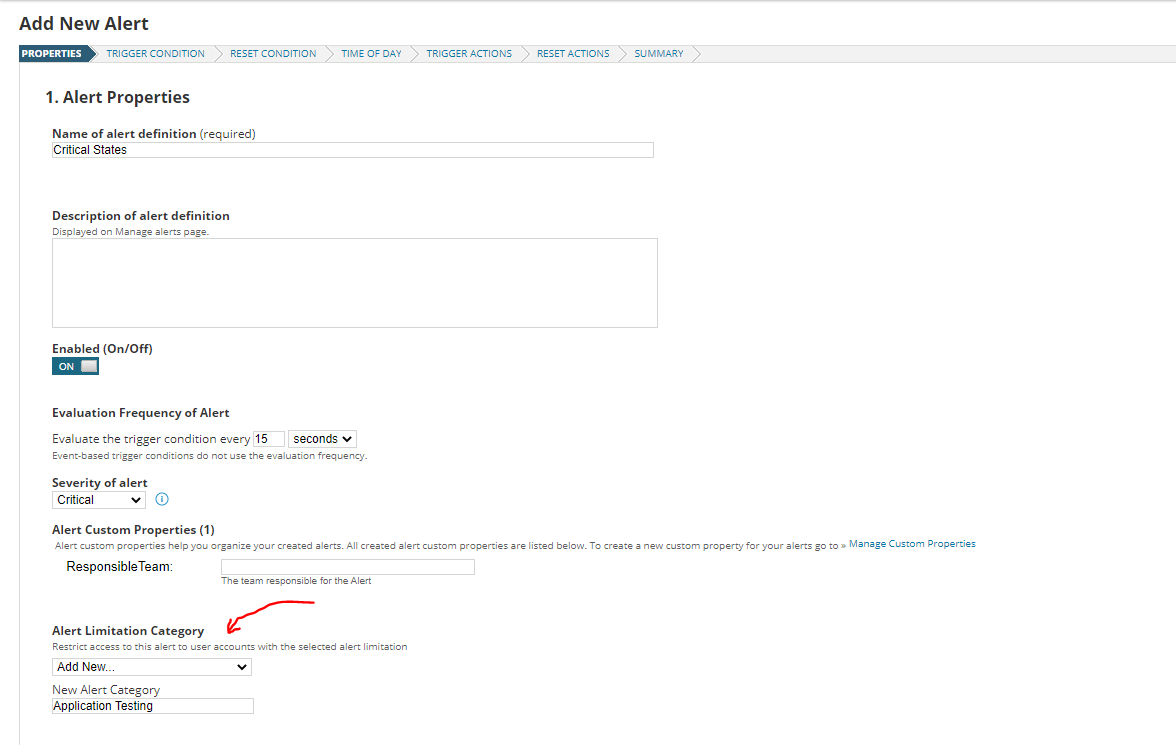
04.) After configuring the Alert, you can also configure Alert Limitation (Category-wise.) as I have marked below.
05.) Click on Next and you will see the below menu to configure Advanced Alert Options.
06.) Adding a Timer is important when configuring Advanced Alert Options. This is useful for filtering out anomalies and temporary spikes from more serious Alert Events.
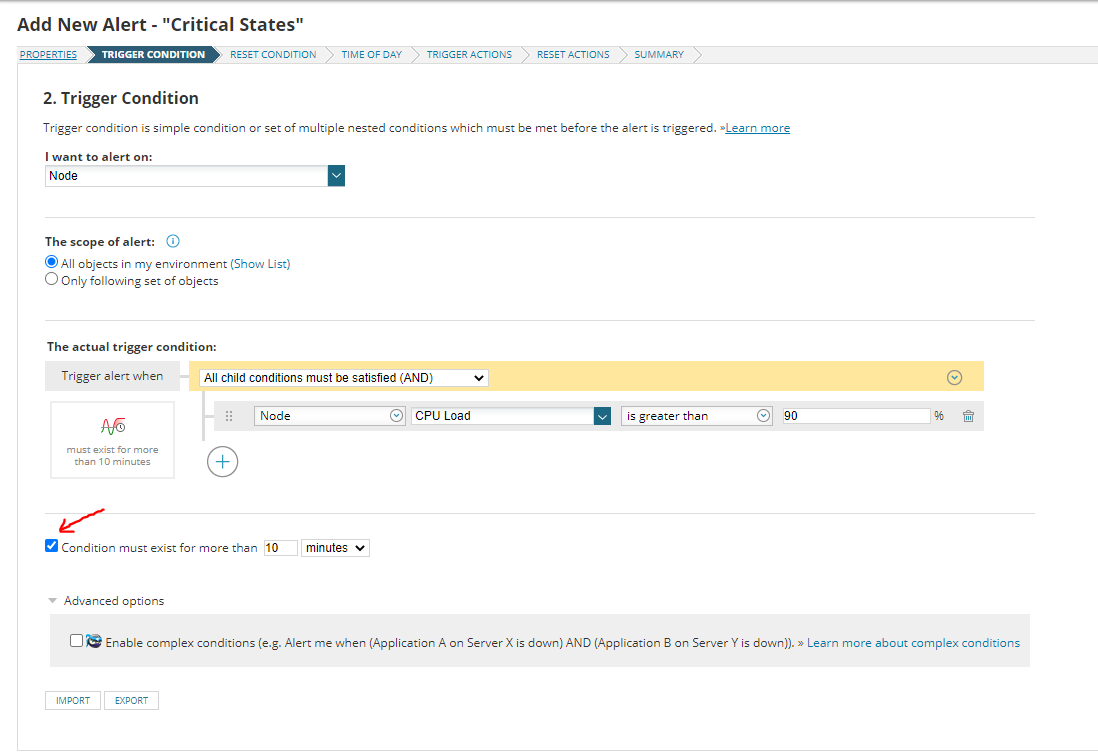
07.) Below the Condition Timer, there is an Advanced Options section. If you want, you can enable complex conditions by ticking that check box. When you enable complex conditions, a new check box will appear under Condition Timer.
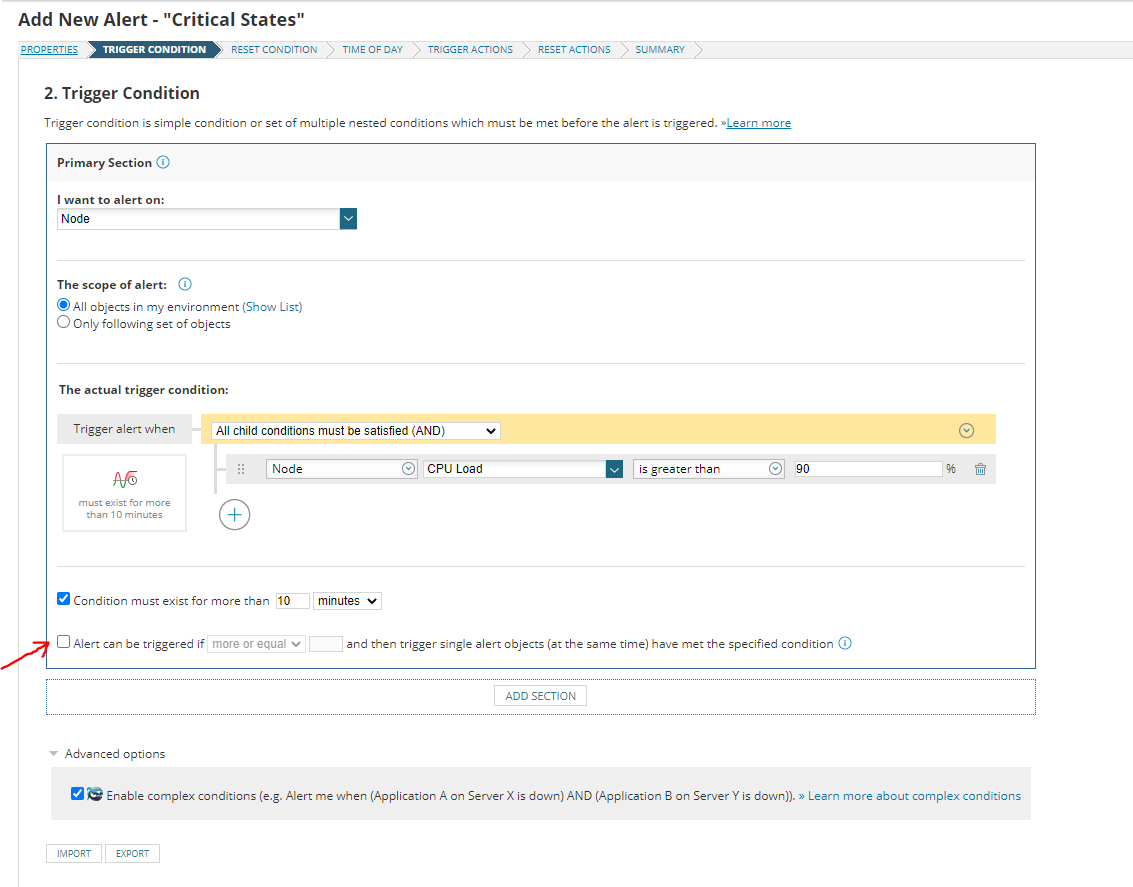
08.) This new check box will allow you to look for multiple Alert Events before triggering an alert. You can increase the number of Nodes so that it will notify you when all the Nodes go down.
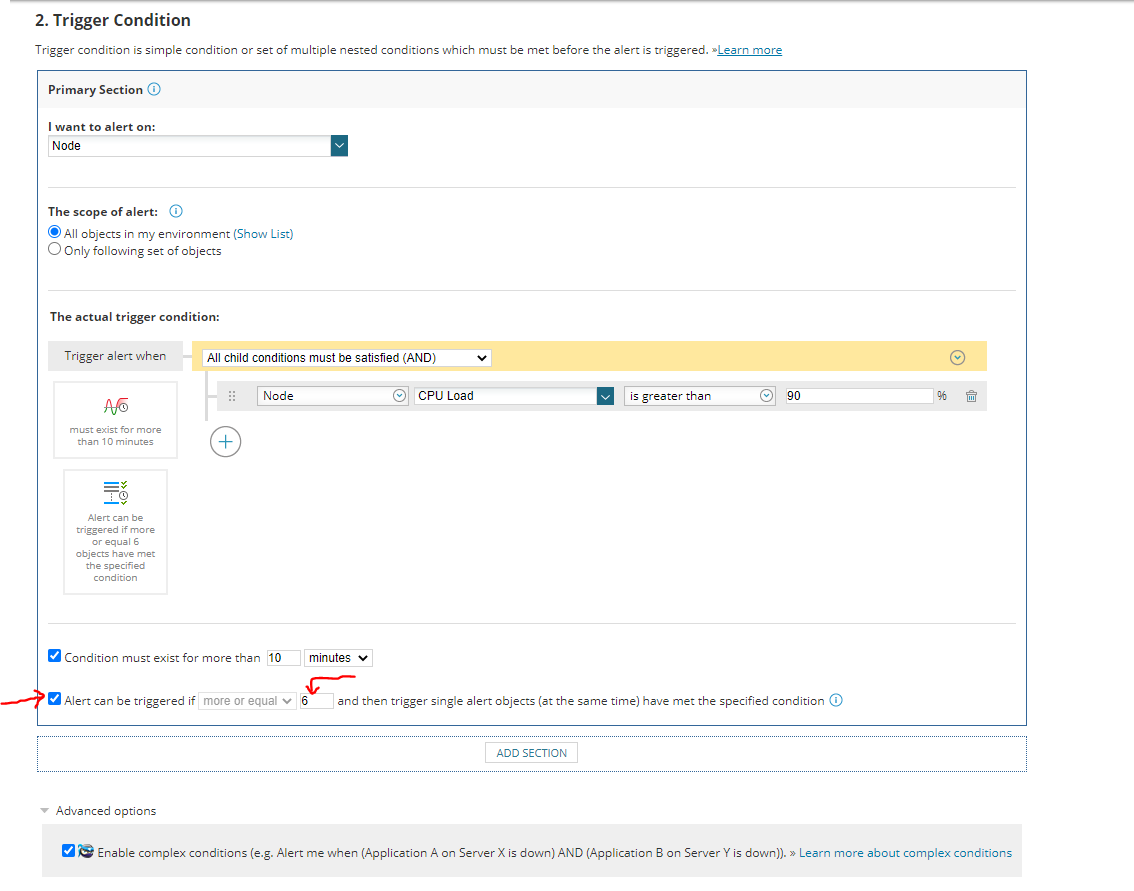
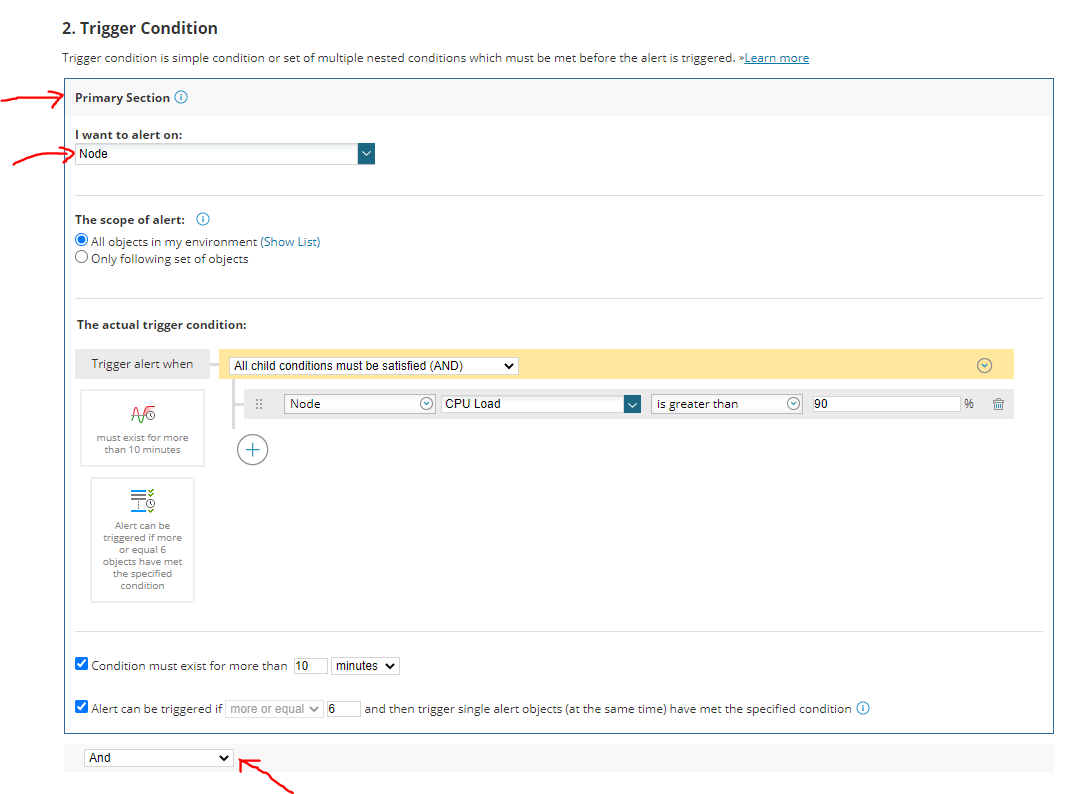
09.) In the above screenshot, you can see ADD SECTION button. If you want, you can add a new section to your alert which has a completely new set of Alert Logic Conditions.
10.) In the Primary Section, you can look at Nodes, and in the Secondary Section, you can look at Applications or Interfaces.
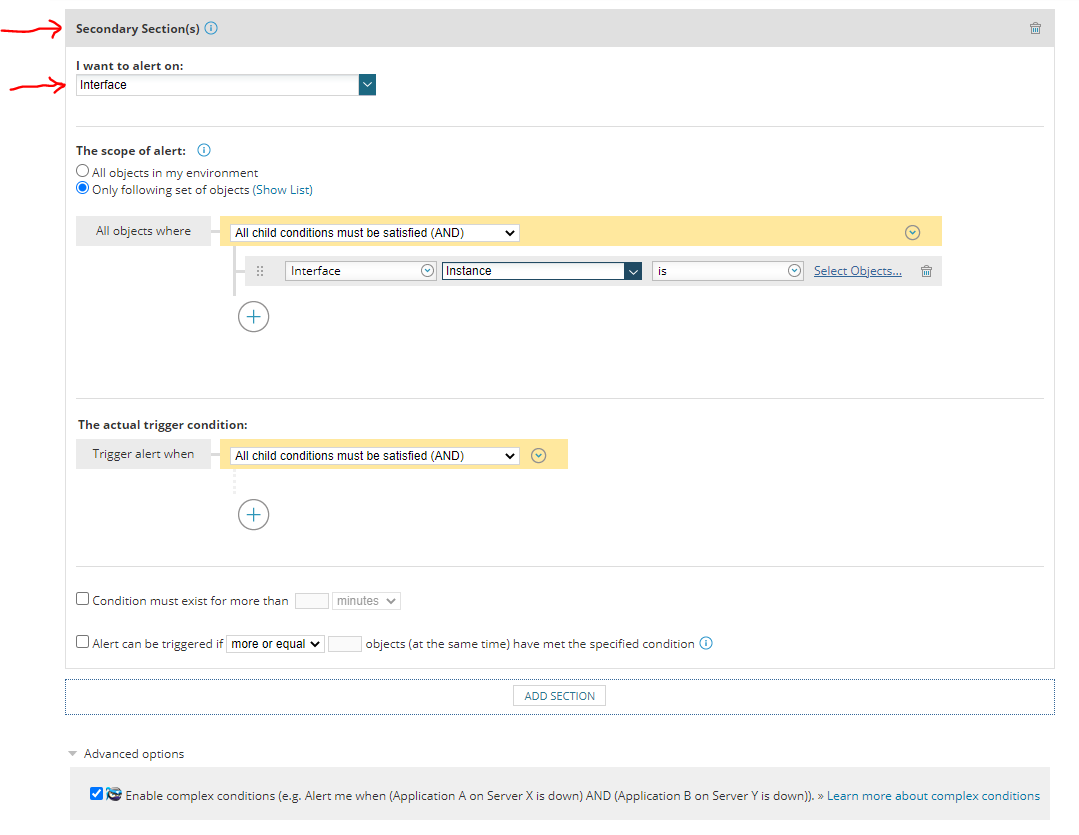
11.) Click on Select Objects and you can select your preferred device.
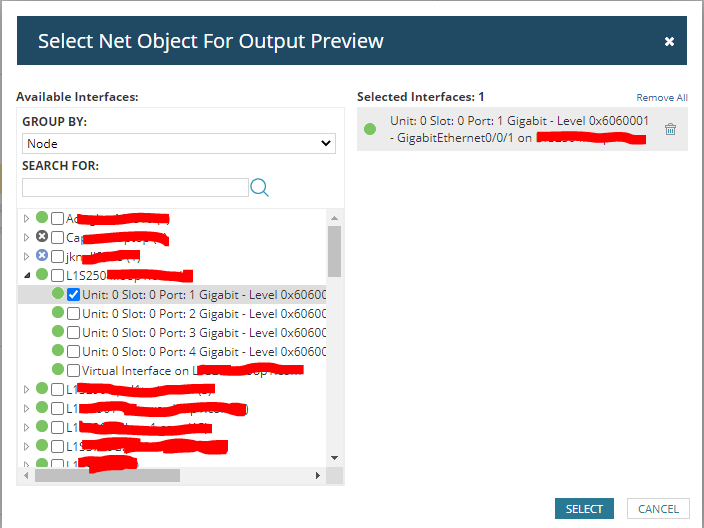
12.) Now when the alert runs, it will check the status of your Node and Interface accordingly.
13.) You can add as many additional logic sections as you need and you can create very complex alerts.
14.) Please note that each logic section is joined by an AND statement.
15.) So, the trigger conditions in each of the logic sections must be met in order to trigger an alert.
