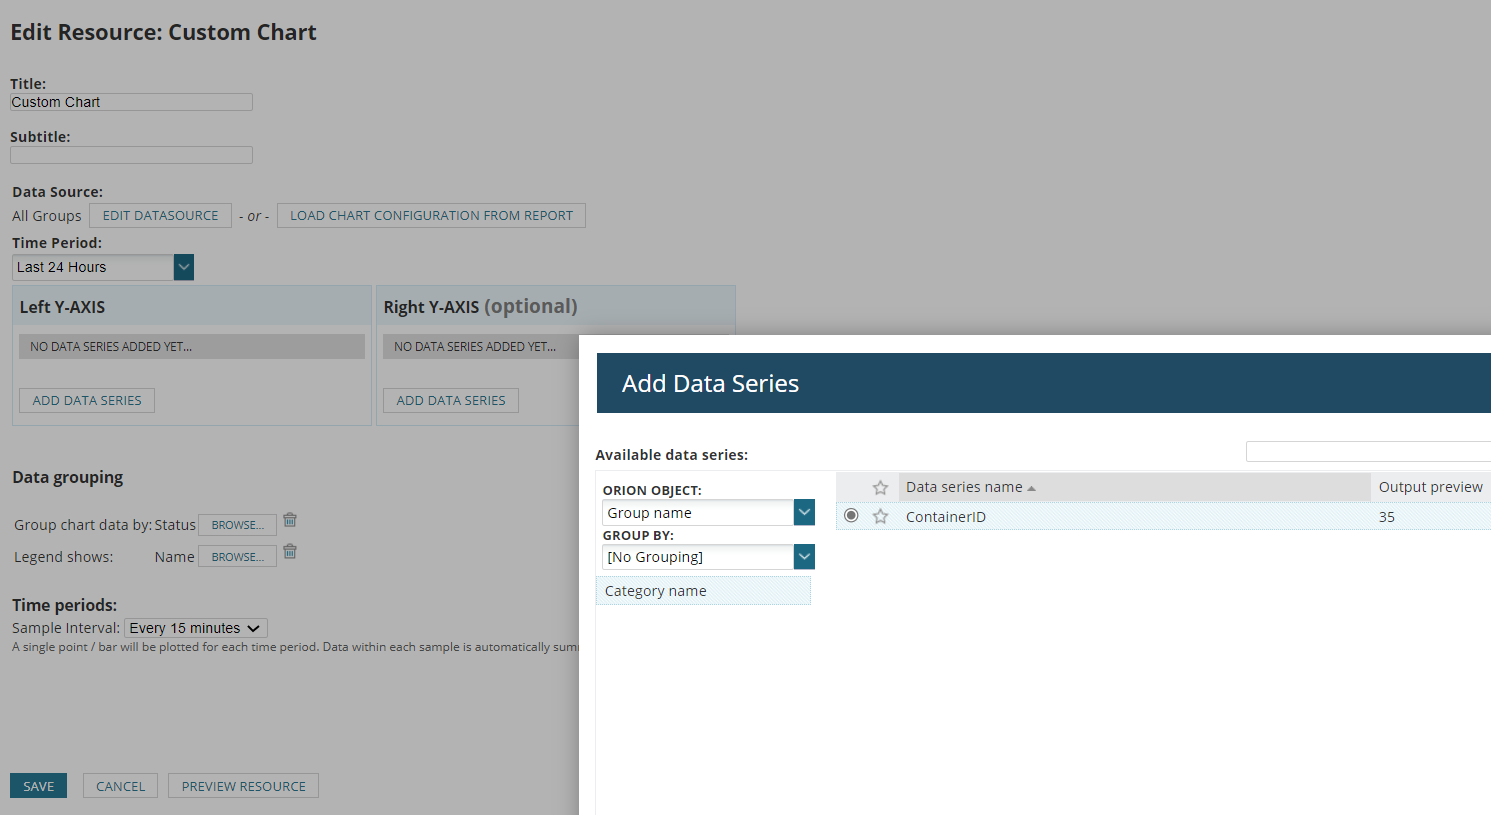
We have a requirement from management where they would like to see a list of groups and the status history over the last 24 hours in a timeline graph. I am not able to create a widget with the current defaults, it seems like I am only able to show Availability Statistics and not status.
I am trying a workaround by creating a custom graph and it looks like the correct information is available but I am having trouble.
The status data I would like to see is in the ContainerStatus Table, so I am creating a custom Graph with SWQL. Is there anyway to change the Status to be reflected in the graph?
SELECT TOP 1000 ContainerStatus.Container.Name, ContainerID, tolocal(DateTime) as DateTimeLocal, Status
FROM Orion.ContainerStatus
WHERE DateTime > ADDHOUR(-24,GETUTCDATE())
AND ContainerStatus.Container.Name like 'Apps%'