Smart nodes list I imagine multiple widgets for windows servers, Linux servers, Network devices. For items that are in duress and only those items.
Since "under pressure" can mean different things to different devices, you might want to rely on the native Thresholds and their reflected status.
Also, did you want this on a classic dashboard (called a 'view') or a Modern Dashboard?
Why would you segregate Windows vs. Linux vs. Network Gear? As far as Orion is concerned, they are all "nodes" and you can get the CPU, Memory, and Response time for each of them from the same place.
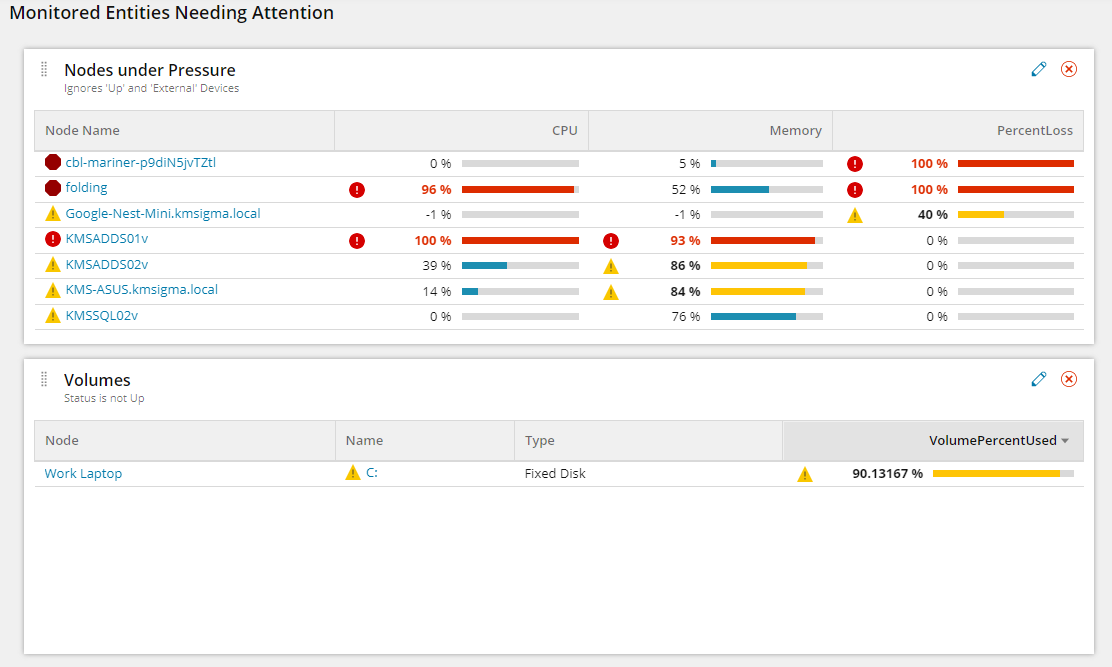
You could do something like this in Modern Dashboards
Kevin,
Thanks for your reply. I am wanting to master modern dashboards and SWQL type dashboards. What you showed is a great start. Can you share your query? Thanks Matt
I can do you one better. Here's the entire dashboard (as a JSON) which you can import using the Import-ModernDashboard PowerShell function in OrionSDK/func_ModernDashboards.ps1 at master · solarwinds/OrionSDK (github.com).
Import-ModernDashboard
[View:/cfs-file/__key/communityserver-discussions-components-files/45/Monitored-Entities-Needing-Attention.json:480:240]
This dashboard doesn't use any Custom Properties, so it should work for anyone. It was created on Orion Platform 2020.2.6 HF1 (current version as of today).
Awesome!!!!! Trying it now. Thanks
This also reminds me of an old sql dashboard I remember being on here that assigned various weights to different kinds of bad conditions and then made a table of nodes sorted by how unhappy they were. Something like node down would be 1000 points, high cpu might be 200. I've also built swql dashboard for ops teams that had a ton of case logic embedded and unions where it would set different messages and include extra info on each node depending on the issues being detected. It had all devices grouped up by where they fell in the data flow with edge firewalls at the top and going down through the aggregation layers until bottom being top of rack switches. If no issues it would just display something like "edge firewalls are all ok" if not then it would list out falling conditions for devices in that category. Was pretty useful for the Noc at a big ISP.
Thanks for all of the input guys. My new Dashboard(s) is starting to take shape. So one dash I would like to add is for volumes with less then 2 weeks forecast. I found this query from @jest4kicks (Thanks Michael) and made a couple of small changes, and I am wondering how I convert/join etc to take the node ID to convert to actual node name.
My Query:
SELECT VolumesForecastCapacity.DisplayName, VolumesForecastCapacity.NodeID, VolumesForecastCapacity.CurrentValue, VolumesForecastCapacity.DaysToCapacityAvg FROM Orion.VolumesForecastCapacity AS VolumesForecastCapacity
LEFT JOIN Orion.Settings s ON s.SettingID = 'ForecastMinDays'
LEFT JOIN Orion.VolumesCustomProperties p ON p.VolumeID = VolumesForecastCapacity.InstanceID
LEFT JOIN Orion.Volumes v ON v.VolumeID = VolumesForecastCapacity.InstanceID
WHERE VolumesForecastCapacity.InstanceCaption != 'Virtual Memory'
AND VolumesForecastCapacity.InstanceCaption != 'Physical Memory'
AND VolumesForecastCapacity.InstanceCaption != 'Real Memory'
AND VolumesForecastCapacity.InstanceCaption != 'Memory Buffers'
AND VolumesForecastCapacity.InstanceCaption != 'Cached Memory'
AND VolumesForecastCapacity.InstanceCaption != 'Shared Virtual Memory'
AND VolumesForecastCapacity.InstanceCaption != 'Shared Real Memory'
AND VolumesForecastCapacity.InstanceCaption != 'swap space'
AND VolumesForecastCapacity.DaysToCapacityAvg <= 14
AND VolumesForecastCapacity.MetricName = 'Forecast.Metric.PercentDiskUsed'
AND DayDiff(VolumesForecastCapacity.MinDateTime, VolumesForecastCapacity.MaxDateTime) >= ISNULL(s.CurrentValue, 7)
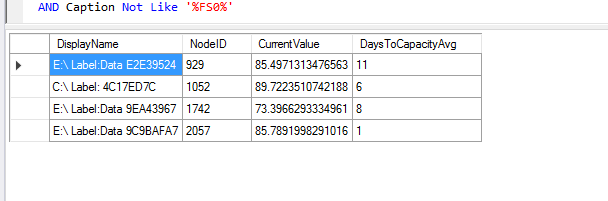
AND Status = 1 AND Caption Not Like '%VM%' AND Caption Not Like 'MCPITSOLRWNDS2' AND Caption Not Like '%perf%' AND Caption Not Like '%test%' AND Caption Not Like '%Stage%' AND Caption Not Like '%DEV%' AND Caption Not Like '%QA%' AND Caption Not Like '%FS0%'
Which gives me this:
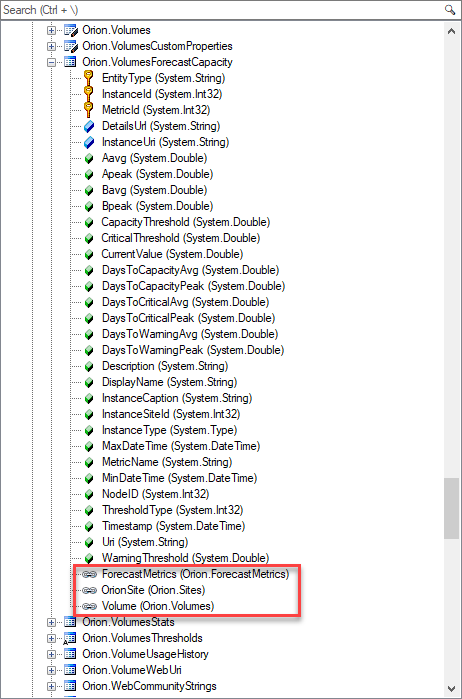
You can get rid of all of those joins if you just use the Navigation Properties (shown bound in red below).
Orion.VolumesForecastCapacity connects to Orion.Volumes, which connects to Orion.Nodes.
Orion.VolumesForecastCapacity
Orion.Volumes
Orion.Nodes
I'm pretty sure that will give you what you need:
SELECT [VForcast].Volume.Node.Caption AS [Node Caption] , [VForcast].DisplayName , [VForcast].CurrentValue , [VForcast].Volume.Size , [VForcast].DaysToWarningAvg , [VForcast].DaysToCriticalAvg , [VForcast].DaysToCapacityAvg , [VForcast].Volume.TypeFROM Orion.VolumesForecastCapacity AS [VForcast]WHERE [VForcast].DaysToCapacityAvg <= 100000 AND [VForcast].Volume.Type IN ( 'Fixed Disk' , 'FixedDisk' , 'Mount Point' , 'Network Disk' )ORDER BY [VForcast].DaysToCapacityAvg</pre>Obviously change out the DaysToCapacityAvg number in the WHERE clause to something more reasonable. I used 100000 to guarantee results in my environment.
DaysToCapacityAvg
awesome and thanks Kevin,
How do I add exceptions like:
WHERE Vendor = 'Windows'AND Caption Not Like '%VM%'AND Caption Not Like '%perf%'AND Caption Not Like '%test%'AND Caption Not Like '%Stage%'AND Caption Not Like '%DEV%'AND Caption Not Like '%QA%'
My Reply was spam? LOL