The ootb Orion alerts may be too general (e.g. a Node/Component is in warning or critical) or too sensitive (hundreds of alerts triggered every day) for users. Users sometime disable a lot of them or setup a rule in mail server to ignore them which is really limiting Orion's power. Here we will provide a few practices to enhance these situation.
1 : Upgrade to Orion platform v2019.2 or later.
Starting from this version, Orion introduced a feature called Enhanced Node Status. It will consolidate all monitors of a node and roll up to the Node status. In the case of a node is experiencing high CPU, high bandwidth usage, etc., you will only receive 1 node in warning/critical alert with root causes, instead of multiple alerts for each of the metrics.
2 : Adjust alert threshold.
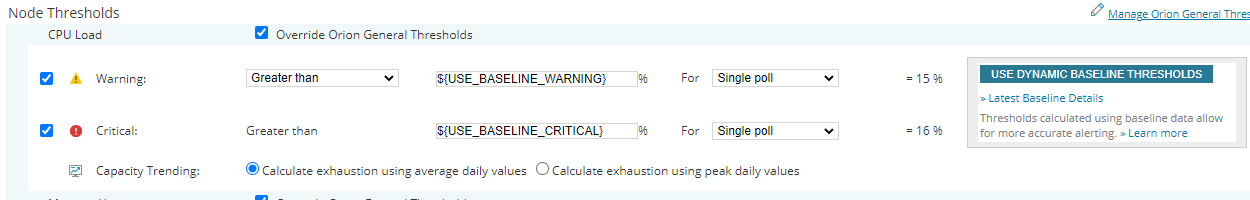
For each object monitored by Orion, there are default warning/critical thresholds associated with it, such as usage metrices > 80/90%, latency >100 ms. These are general settings for most common environments, but they may not be suitable for all users. So adjust the related thresholds will help reduce (sometimes increase) the number of alerts would be triggered. Users should adjust alert thresholds based on their observation, historical data or actual business requirements.
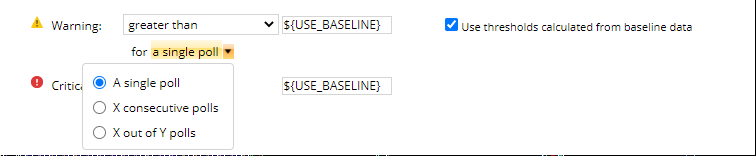
Also, users can enable threshold/baseline calculation for a lot of the metrics (e.g. CPU, processes) collected by Orion. This in most cases help users understand their real performance issues and changes.
3 : Enable 'Condition must exist for more than xx minutes'.
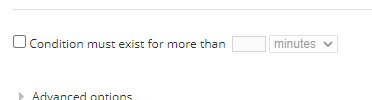
This setting can help with reducing flapping alerts in most cases. The actual time configured here should consider polling frequency of the metrics, alert evaluation frequency, etc.
4 : Leverage custom properties.
Instead of applying an alert for all nodes, use custom properties to only include/exclude objects should be evaluated by an alert. For production/critical objects, users may want more frequent evaluations but less sensitive threshold, e.g. evaluate every minute and alert me of my SQL server when Memory usage is greater than 96%, while non-critical objects may only be evaluated every 30 minutes when my file server's available disk space less than 20%. Create the associated custom properties and configure them for the monitored objects, then include that in alert trigger condition (AND option). To apply this to ootb alerts, users should disable the original ones, make duplicates and change the trigger conditions.
5 : Leverage Advanced options
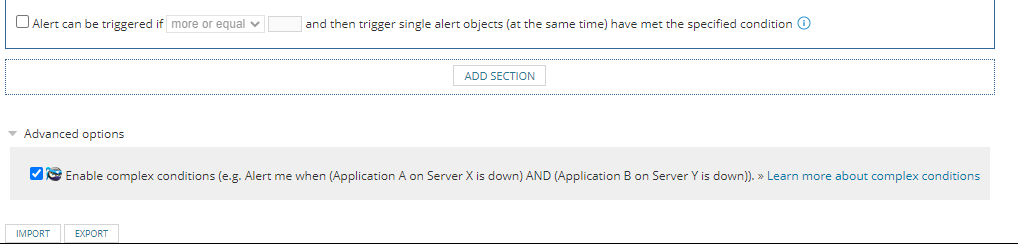
This will allow users to evaluate multiple conditions before triggering alerts. For instances, if an application is running in a cluster and when failover happens, Orion can evaluate all members' status and send out notice when all members are not working.
6 : Leverage Group function
Users can put multiple linked objects, dependent objects or members of a service in a group and alert based on the group's status. This will require users to add extra variable 'Group Status Root Cause' into message to provide more details.
7 : Configure extra Trigger Actions
The default actions usually includes log messages to web console and send email (need to configure default alert email recipients and SMTP servers), and users can add extra actions or escalations to take extra activities. For instance, to integrate with an ITSM/ticketing solution, users can use the default SolarWinds SSD/ServiceNow action or configure another send email action with required details. Use Https Get/Post to interact with a 3rd party API or run external program to execute a batch/PowerShell file for automation/remediation. For some products, such as NCM and Vman, there are specific alert actions to make changes on the objects triggered alerts.
8 : Unmanage and Mute Alert.
For devices go into maintenance/change mode, users could consider using unmanage or mute alert to reduce the amount of alerts trigger by them.
When put objects into Unmanage mode, Orion will stopped polling them, so there will be no data to be collected and stored in database, and alerts will not be triggered due to no data to evaluate. This will impact reporting (less data samples)/charting (gap).
When put the objects in Mute Alert mode, Orion will still collect data and mark the objects as warning, down, etc. but will exclude them from all alerts' evaluation. This will impact reporting, such as availability.
9 : Leverage Dependency
Orion can automatically suppress alerts on child objects when parent object is down based on dependency info. The dependencies could be automatically detected by Orion, such as VM on a host, interface on a node, or user created.
10: Add extra details in alert Message
It is better to add extra details (manually entered, using Insert variables, SQL/SWQL) into critical/most used alerts' message to provide more context. For instance, there is a tool used in SAM's high CPU utilization with top 10 Processes, it could be reused in other alert actions to provide process usage info.

10: Create your own alerts
When the ootb alerts can't meet business requirements, it's time to create new alerts. It is easier to start with duplicating an ootb alert and modify a few of the trigger conditions.
For trigger conditions, it's better to start with a testable threshold instead of the actual/ideal scenario, e.g. trigger when CPU usage is over 10% instead of 85%. Verify the alert is triggered on one or multiple nodes and actions are taken place before changing the threshold to the ideal range.
For reset conditions, in most cases users can use 'when trigger conditions are no longer true'. However, for the alerts looking for numeric values, it's better to specify an actual value to reset too, e.g. when trigger condition is set for CPU usage > 85%, the reset condition is better for CPU usage < 75%.
For some rare cases, users may have to use SQL/SWQL to structure the trigger conditions. This would require more knowledge on the querying skills and database/SWIS schema. It would also need to consider the efficiency of the query and frequency of evaluation, so it is not over running or causing database performance issue.
There are good examples of custom alerts mentioned in Leon's post Monitoring 201 e-book.