I don't know if it has always been this way and I didn't notice it, or if this is a result of a bug in a recent version, but the "Average CPU Load & Memory Statistics" widget on the Node Details screens shows memory amounts (total size, available, and used) incorrectly.
It looks like instead of dividing bytes in increments of 1024 to get KB/MB/GB/TB, this widget is just dividing in increments of 1000.
Here are a couple of examples:
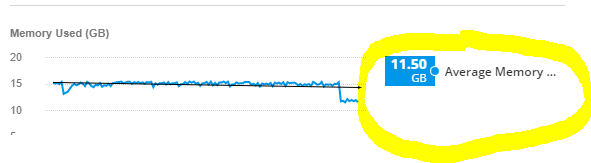
This node has 16 GB of RAM with 11.50 GB used, meaning 5.50 GB available. in the memory used graph here, you see it is correct:
The Disk Volumes widget also shows the correct amount as seen here (well, close, I guess the rounding algorithm is a little different between the two, hence the 11.50 GB used and 11.4 GB used):

But, look at the Average CPU Load & Memory Statistics Widget values. They are WAY off (and no, it isn't virtual memory being added in or anything. This node has like 23 GB of virtual memory):
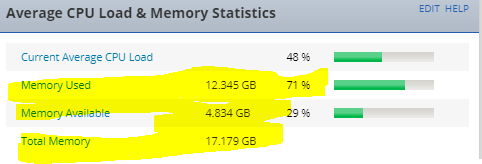
I've noticed this on all node types, whether it be WMI, SNMP, or Agent polled nodes. It seems to be just this widget. While all other widgets and graphs seem to convert the Bytes values that are stored in the database using the proper 1024 values, this widget is just dividing by 1000 for each increment (16 GB in Bytes is 17,179,869,184, divide that by 1,000 three times and you get 17.179).
Can someone from SolarWinds please comment if this is a known bug that is being worked on? This widget is on Node Details pages by default (always has been I think) and is the easiest and most visible way to see the current memory and CPU usage of a node, but, if we can't depend on these values to be correct, (which they aren't right now) then it is pretty useless.
Also, if anyone has a much older version of SolarWinds still running (we are on 2020.2.5), can you reply and let me know if you too are seeing this issue and, if so, what version of SW you are on?