Hello,
I am in the process of building out new Modern Dashboards for different teams within my company. One widget I would like to add is a time-series graph displaying the availability of 10 applications. I am able to create a PerfStack and track availability over time, but I want the 10 data sources to be displayed on one graph. Is there a way to add multiple data sources to the same graph using the Performance Analyzer or am I going about this the wrong way?
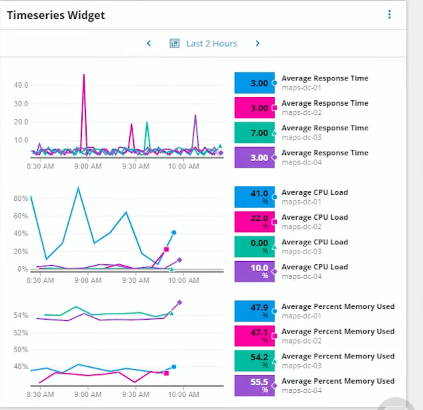
This is an example of multiple data sources on one graph that I grabbed from SolarWinds lab #89.
Any input would be greatly appreciated!
Thanks,
Connor

