Hi,
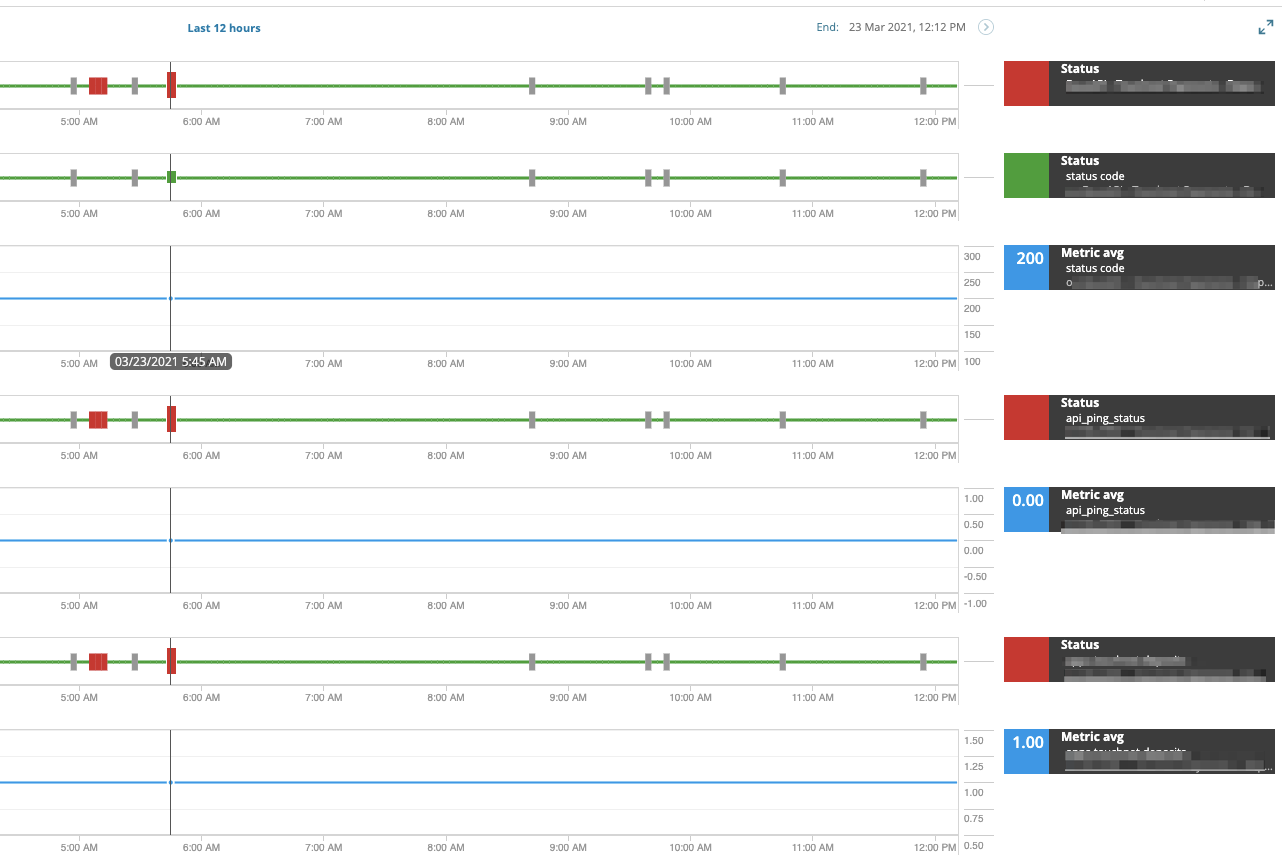
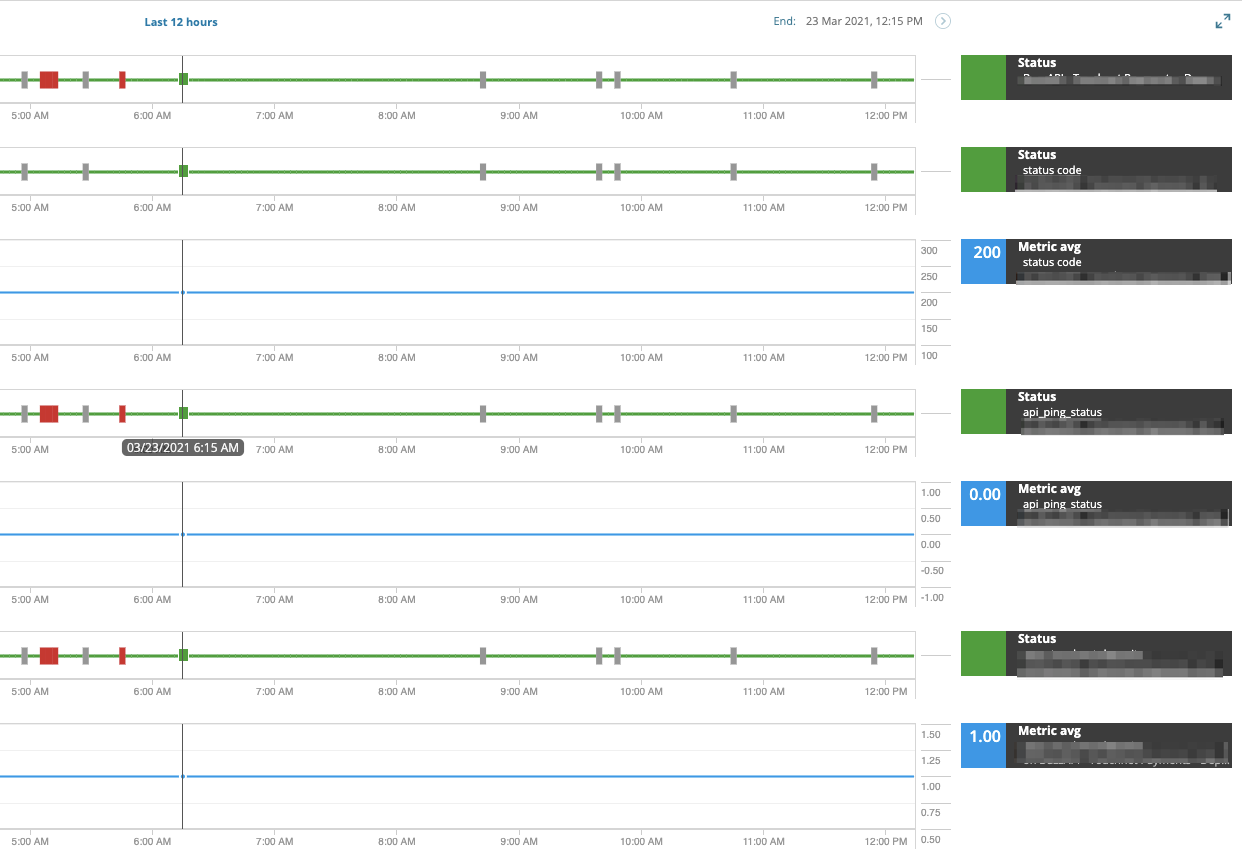
If anyone has experience with API poller, can you assist me in figuring out the below graphs?
I configured certain thresholds to indicate when it's up/down. If you look at the screenshots, when I hover over the red part I see the same value on the right when I hover over the green part. If the values are the same for the red and green portions, why does it flag the poller as 'down' then?