When building a Custom Table or Custom Chart where the object type is Component, you are unable to select statistics from the Process Evidence and Port Evidence tables.
I discovered this when trying to build a chart on the Component Details page that would display historical MaxInstanceCount for process monitors. Unfortunately, this just isn't possible. I then tried to use a custom SWQL query, but unfortunately Custom Tables and Custom Charts don't respect the ${ComponentID} variable like Custom Query widgets do (which I was really hoping would have been added as a feature by now considering how incredibly useful that would be...).
I thought maybe it was because I was on a Component Details page, so I tried building a Custom Table and Custom Chart on a new report and still, there is no way to filter by or add Process Evidence statistics or Port Evidence statistics to a Custom Table or Chart...
I imagine this is just some kind of oversight in the code, so I was hoping maybe good old @aLTeReGo could look into it and let me know the best way to go about getting this fixed? I thought about a Feature Request, but like I said, it kind of just seems like an oversight and/or bug, so I didn't really think that was appropriate. Plus, I didn't think that would get seen by the right people. I could put a case in maybe? I don't know.
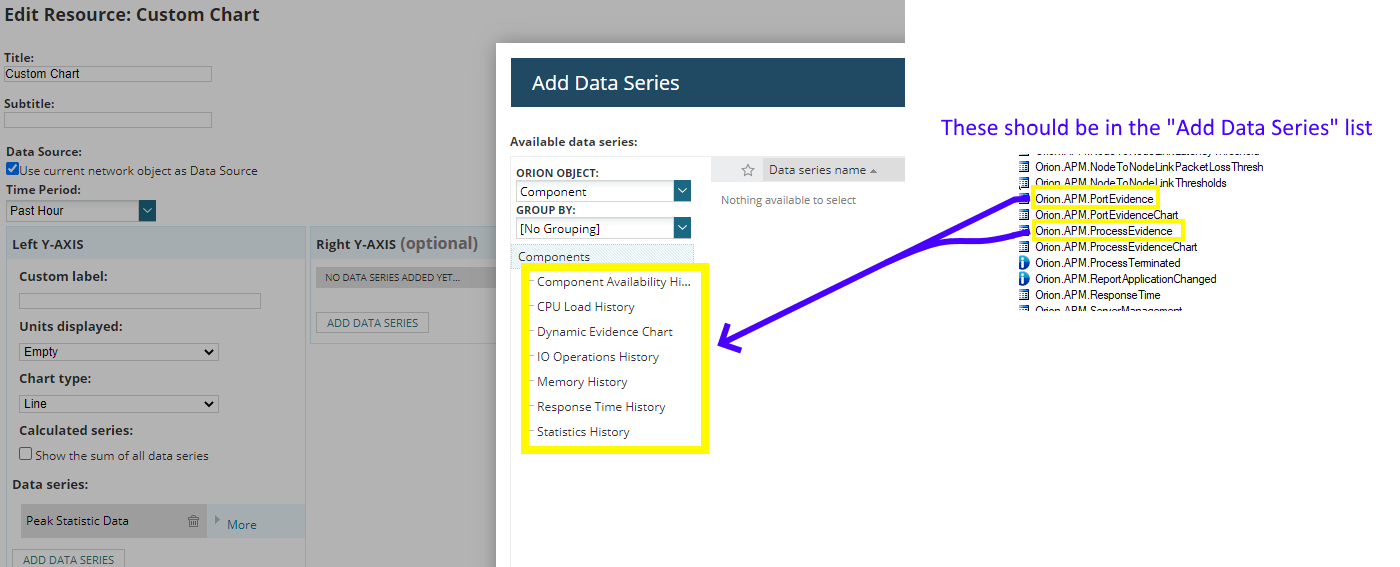
Here's an example of trying to add Service/Process or Port statistics to a Custom Chart. You just can't do it: