What is the time frame for the default Top XX Interfaces by Percent Utilization?
We'd like to create a custom widget for Last Hour but I'm getting duplicate interfaces when I try to use the SWQL Query widget or even through the report widget.
Here's how I setup the report loaded into a custom table widget.
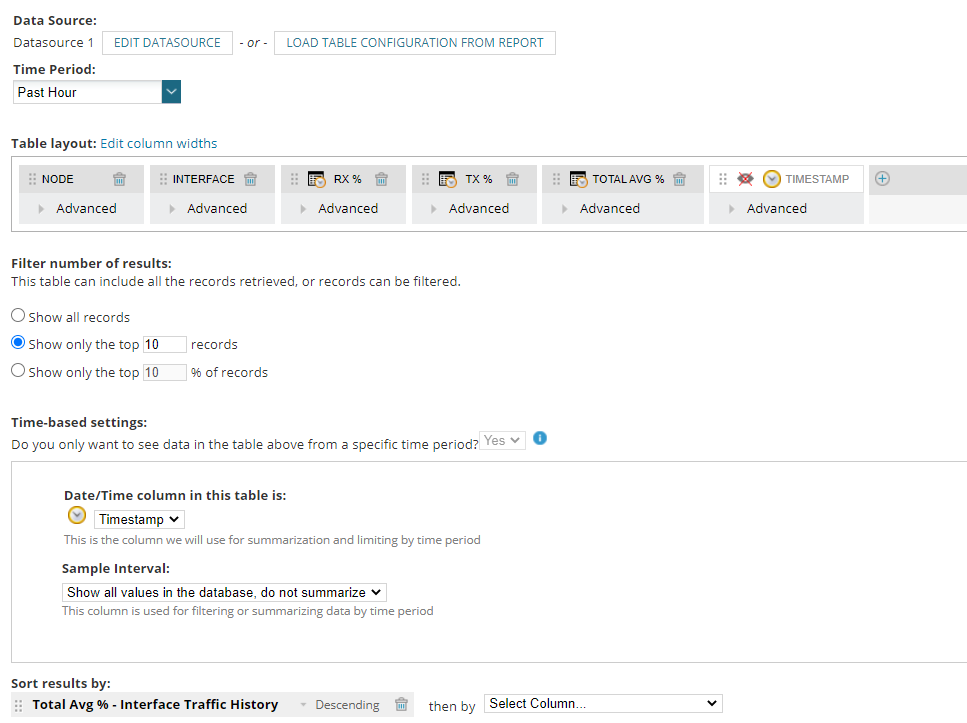
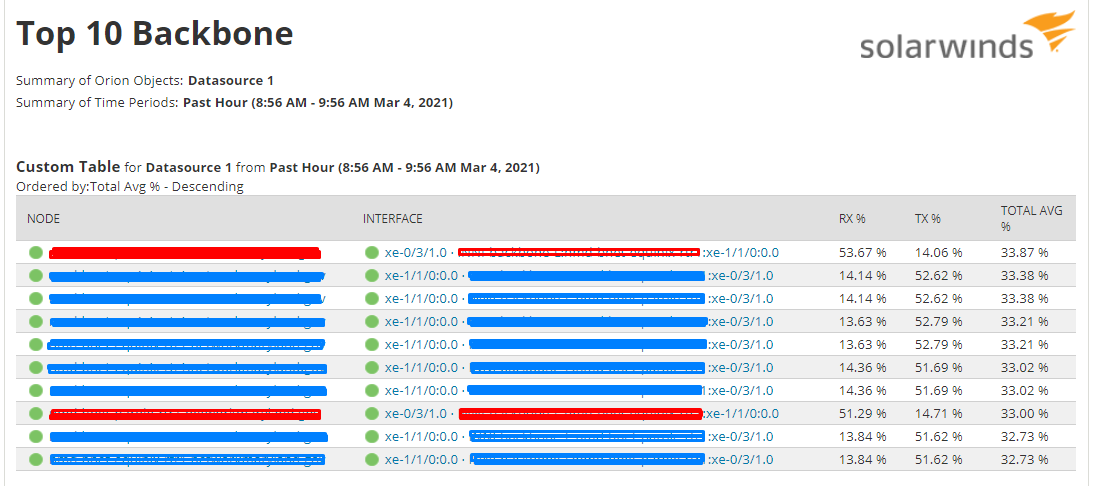
But the report shows duplicates of the same interface. Is its going by top percent like per that timestamp? The Blue/Red lines are all the same router/interface caption.
I get a similar output when I try to use the SWQL query below
SELECT
N.NodeName AS Node,
I.Node.DetailsUrl AS [_Linkfor_Node],
'/NetPerfmon/images/Vendors/' + I.Node.VendorInfo.Icon AS [_Iconfor_Node],
I.Caption AS Interface,
I.DetailsUrl AS [_Linkfor_Interface],
'/Orion/images/StatusIcons/small-' + ToString(i.StatusIcon) AS [_IconFor_Interface],
I.InPercentUtil AS RECEIVE,
I.OutPercentUtil AS TRANSMIT
FROM Orion.NPM.Interfaces I

JOIN Orion.Nodes N
    ON I.NodeID = N.NodeID

JOIN Orion.NPM.InterfacesCustomProperties IC
    ON I.InterfaceID = IC.InterfaceID

JOIN Orion.NPM.InterfaceTraffic IT
    ON I.InterfaceID = IT.InterfaceID

WHERE IC.LINK_CLASSIFICATION = 'INNI-backbone-L'
AND IT.DATETIME >= ADDHOUR(-1, GETUTCDATE())
ORDER BY
I.PercentUtil DESCENDING