We're trying to find a way to display custom poller charts for an individual interface within that interface's details page and only shows that interface's stats.
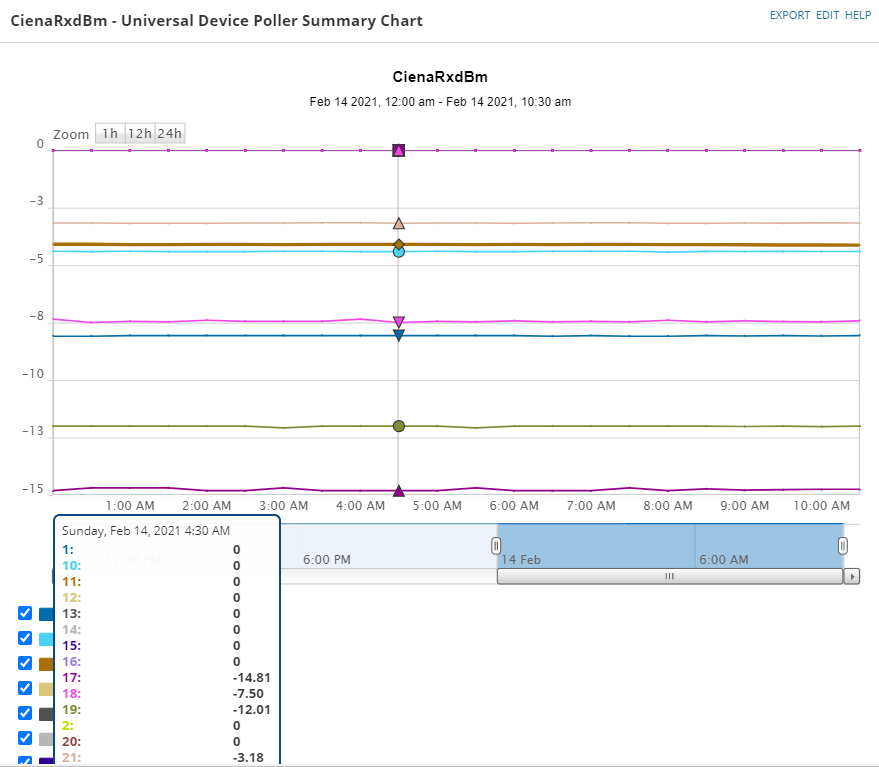
We have Ciena devices and have a poller setup to poll all interface light levels. So far we've only been able to display them all in one chart I'm guessing because they're in a table?
This gets unwieldy on devices that have 48 ports and it would be nice to show thresholds as well but there are different optics with different thresholds so it wouldn't make sense all in a single graph.
The end goal was to be able to see an individual interface's Rx/Tx light levels and maybe add warning/critical high/low light levels which could also be polled OIDs for whatever type optic is being used.
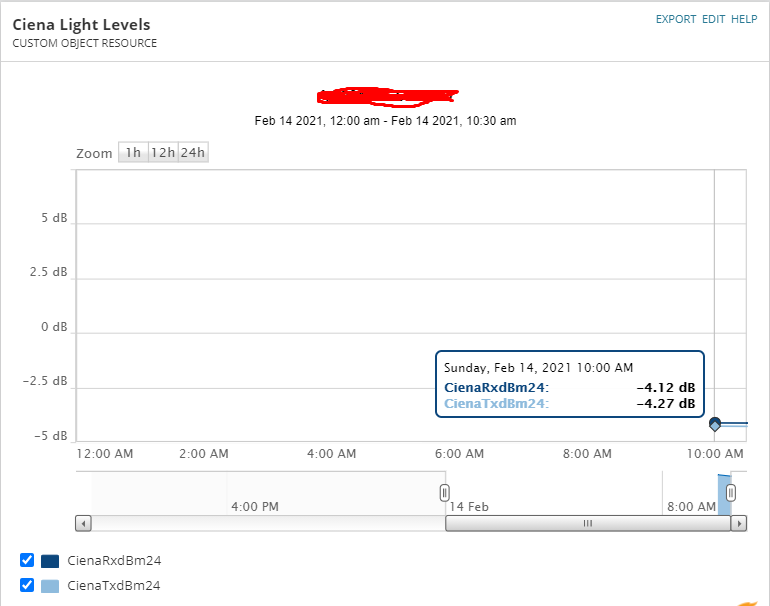
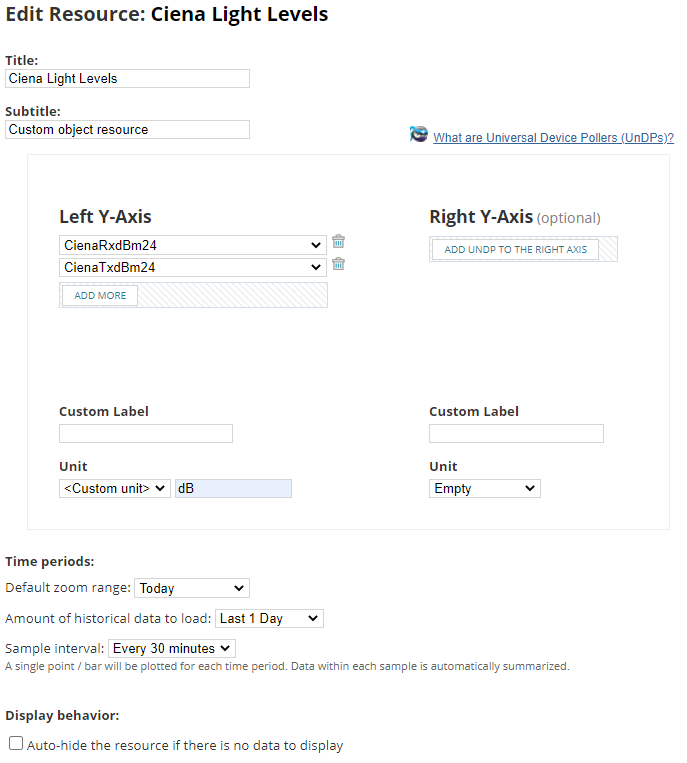
The above was setup using the custom object resource chart and I had tried making pollers for each individual port rather than the whole table but that makes it the template for all interface details pages.
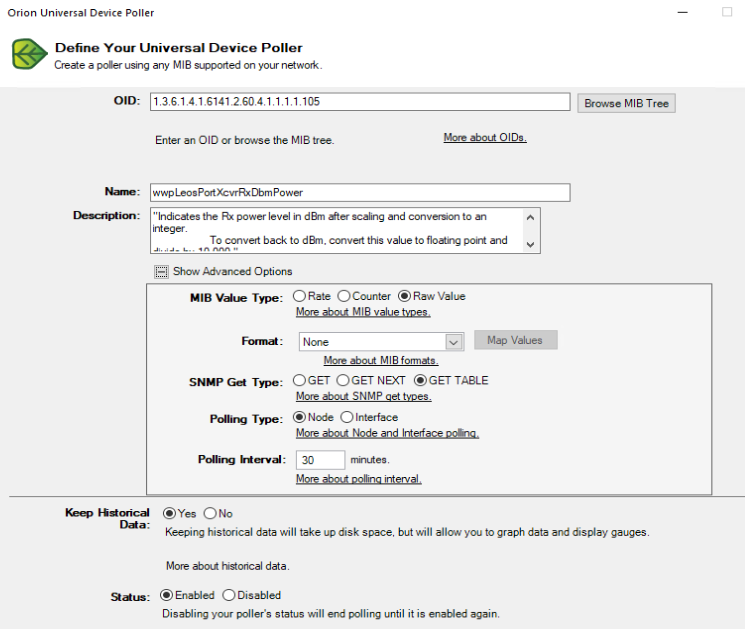
Here's the poller setup that polls the table.
I also tried setting this up through perfstack but ran into an issue where we can't do a transform to divide it by 10000 to get a more readable dbm value.
Is there type of chart that can be added where this could be done? We have this same sort of scenario with a couple other interface stats we'd like to track.