This is super frustrating. I want to graph a single temperature sensor but there doesn't seem to be any real way to do this. I've tried custom charts, I've tried filters. nothing works. What am I doing wrong?
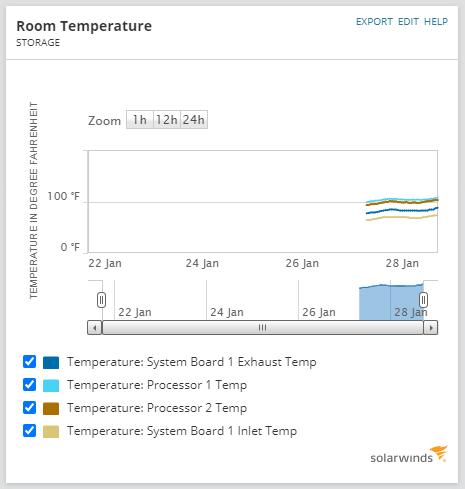
As you can see from the built in chart below, I have a somewhat pretty graph of 4 different temperature sensors. But all I want on this graph is the last one "System Board 1 Inlet Temp" There is no way to not display the other sensors.
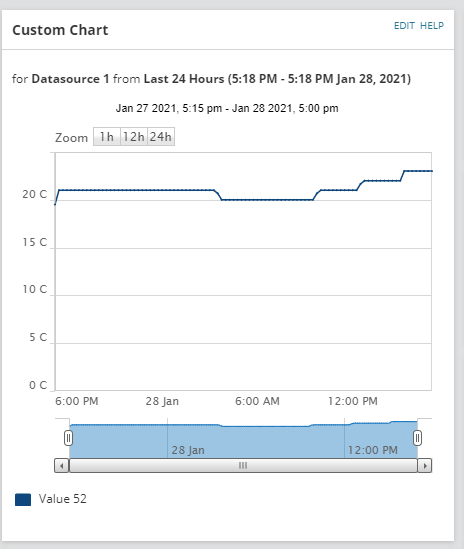
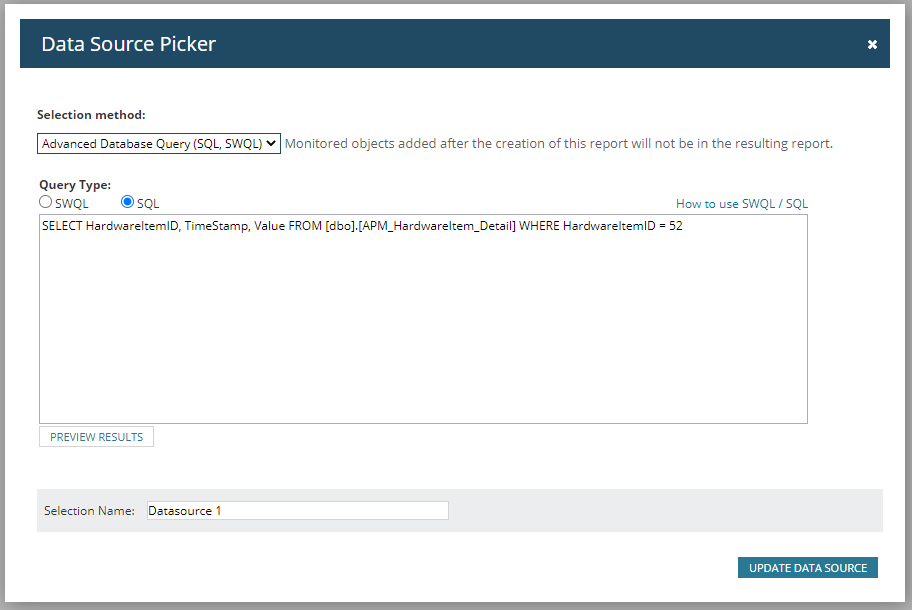
I've also tried a custom chart using a SQL query. But it looks like crap, and also doesn't display the temperature in fahrenheit. How do I get the first graph to only display a single sensor? Or is there some better way to do this?
I'd love to use a perfstack analysys project, but it doesnt allow you to transform the data from celsius to fahrenheit either.
https://thwack.solarwinds.com/t5/NPM-Discussions/Display-Transform-in-Perfstack-for-temperature/td-p/616993