(Please forgive me if this is an obvious question, but all my searching has not come back with a clear answer. Maybe I have the wrong search terms?)
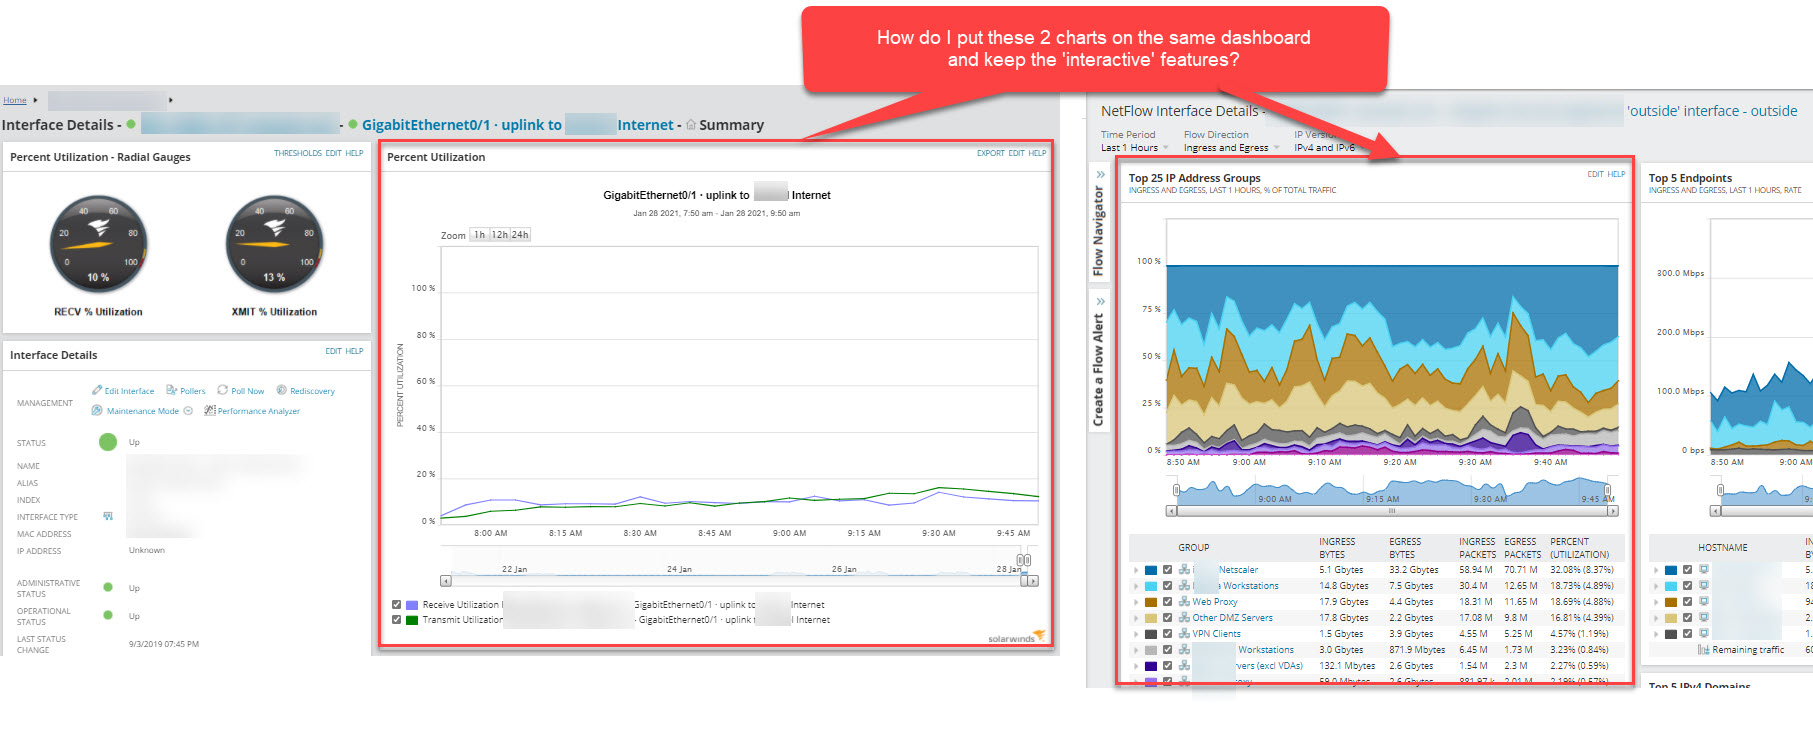
I am trying to build a single dashboard/page in Orion that will show some interactive graphs that are generated from a few different Orion modules. For example, I want to show an Interface % Utilization chart (from NPM) right next to a Top XX IP Address Groups chart for a different interface (from NTA). To add more challenge, the NTA chart I need is filtered further using the "Flow Navigator".
I just can't seem to figure out to get both of these objects on the same page?
(I know I can add Custom Chart to a page and build a similar chart to what I need, but these custom charts are not interactive, and cannot be used drill-down into the data the same way the NPM or NTA pages can).
Picture attached. Thanks in advance for any help.