I created a custom UNDP poller and followed steps to set label from table in this discussion.
https://thwack.solarwinds.com/t5/NPM-Discussions/Custom-Poller-for-Palo-Alto-CPS-Per-Zone/m-p/588394
I don't get the individual zone graphs but the aggregate only. I want individual graph. Below are screenshots of my config.
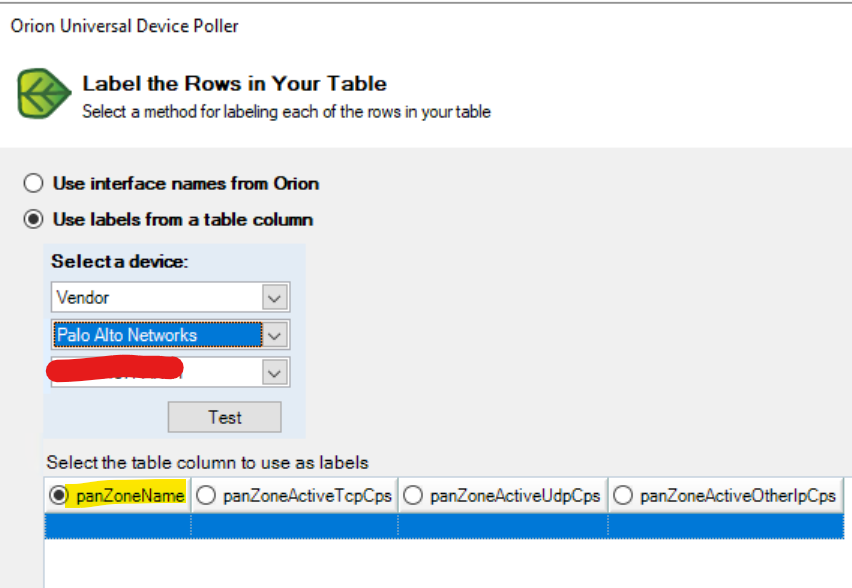
UNDP created and labels assigned
Selected UNDP chart and node
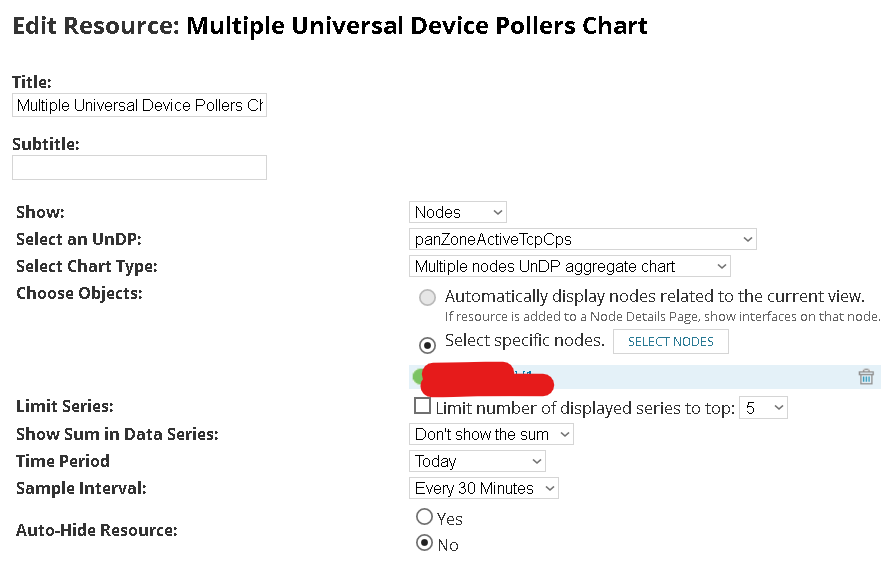
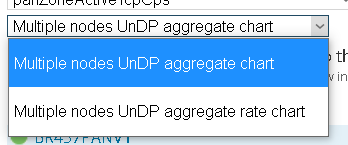
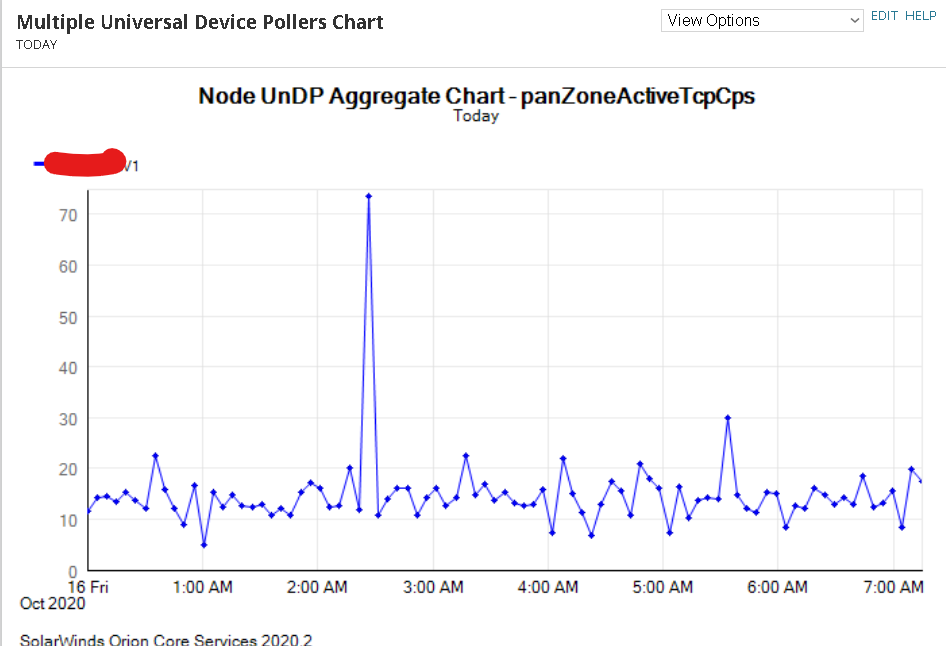
Only option here is for aggregate chart, which i think is stopping it from not displaying individual values of each zone.
This is the chart i get and not for individual zones, which is what this MIB is for and labels test does show all the zones.
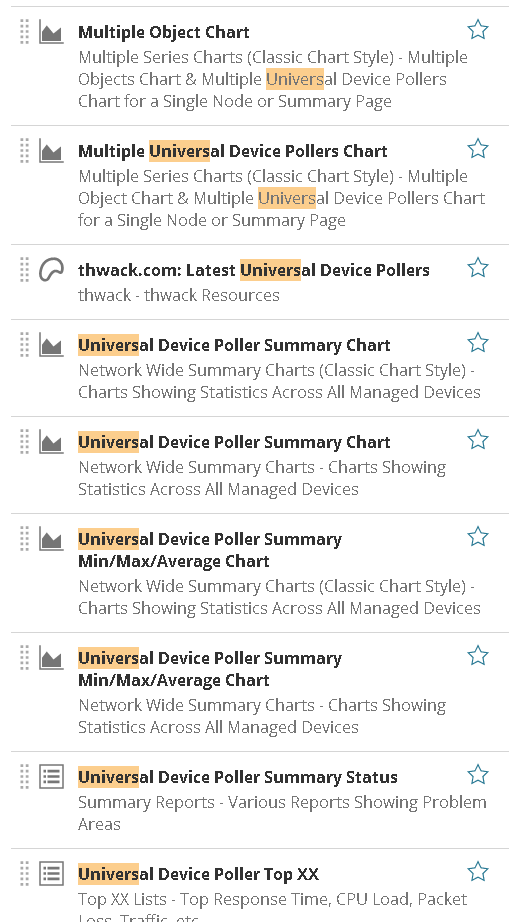
And these are the options i see for universal charts