Hi all,
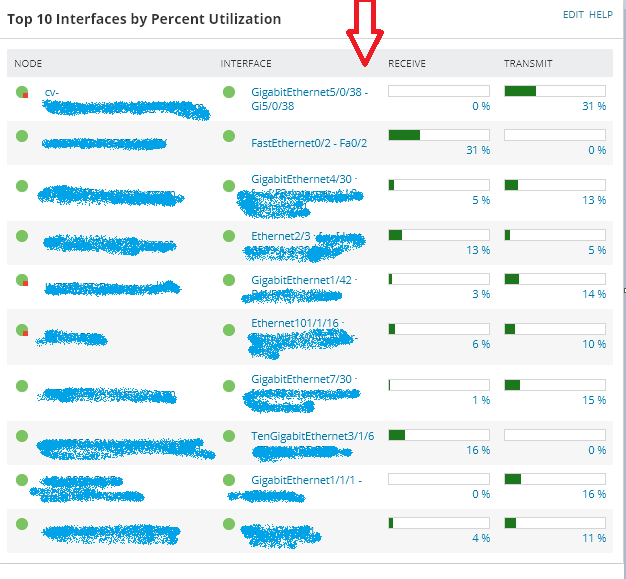
I was able to put a filter to show only the network device on top XX interfaces by percent Utilization widget. However i want to add additional columns like a Custom property (City, etc)
Can someone share inputs?
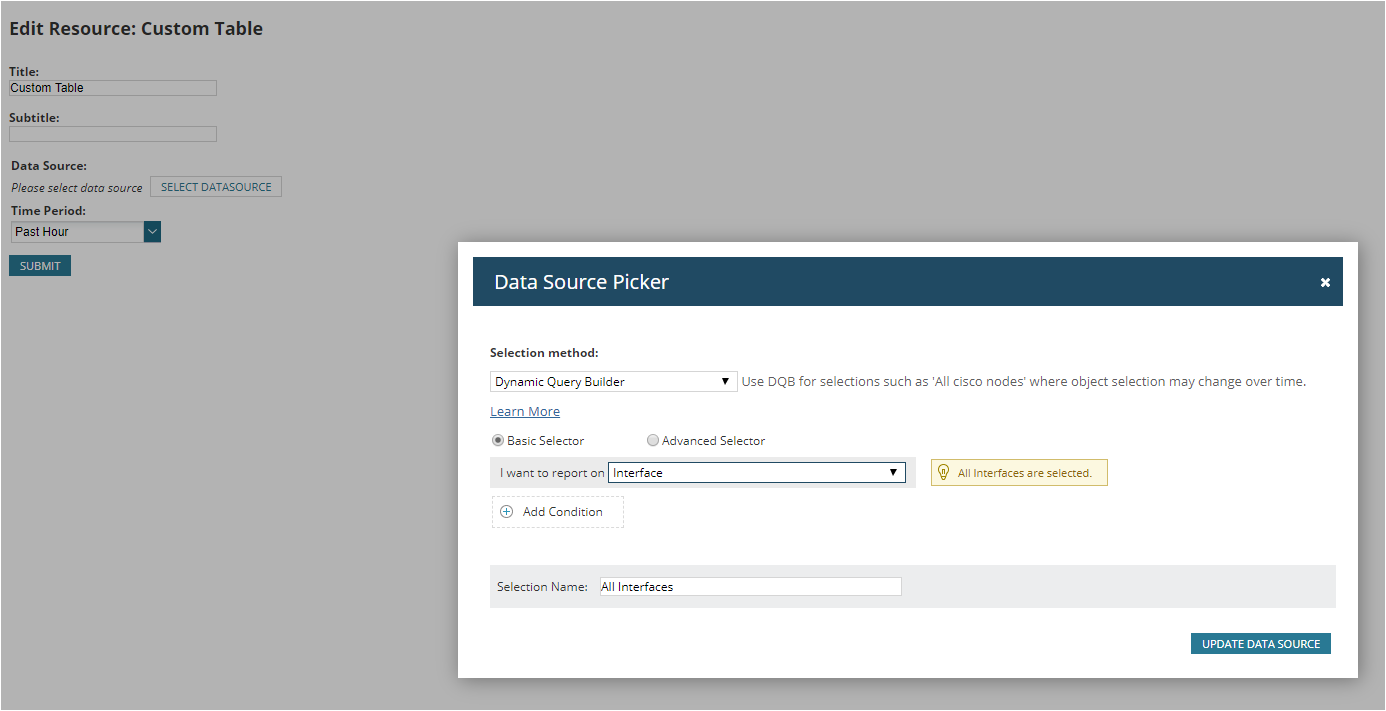
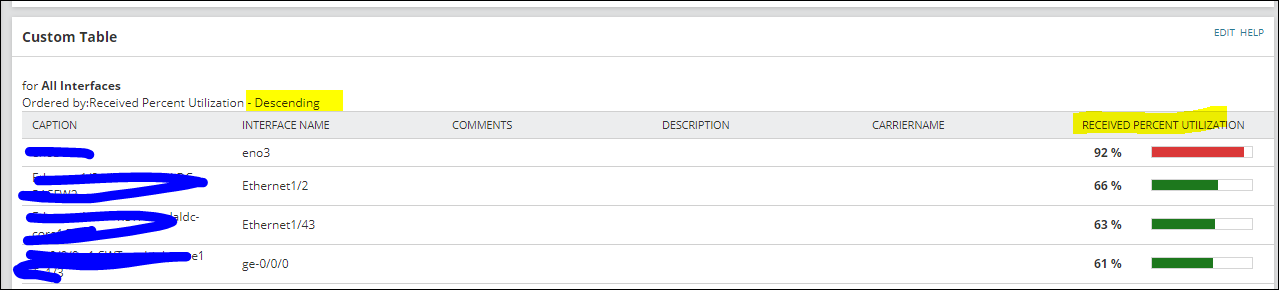
As far as I know - you cannot add extra columns into out of the box widgets. You can, however, build your own. Try to experiment with "Custom Table" widget
Select Interface as an object. Leave filter as is if you want to pull out top 10 for all interfaces
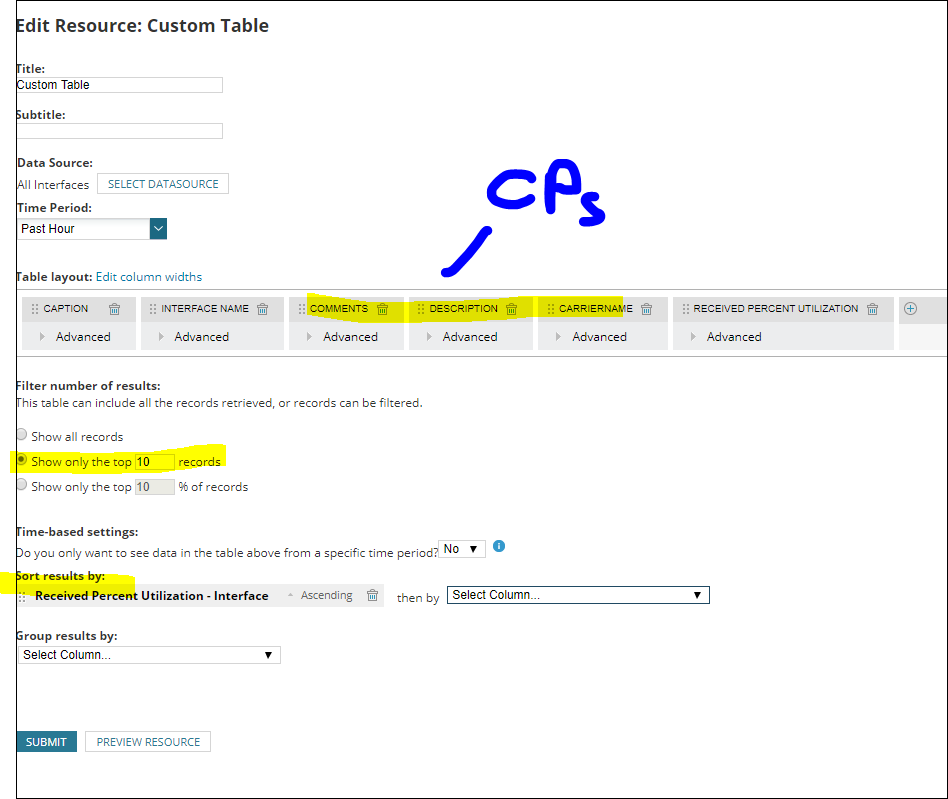
Add columns as you wish - all custom properties are available there
Select top 10
Add sorting
you are done
...
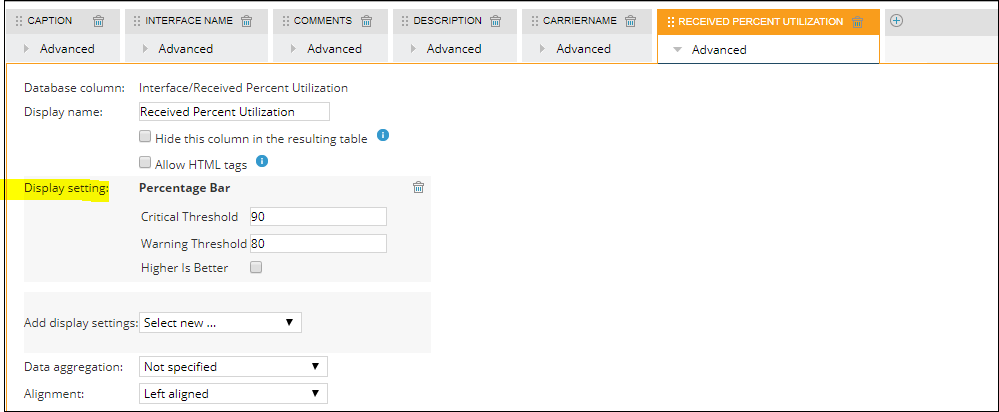
BONUS:
to be able to display percentage bar - do this:
RESULT:
OMG Thank you Alex, I never knew we had an option to modify the display setting.
Awesome Bonus tip.
Cool. The one thing that's bugging me regarding custom tables the info showing up on the left corner (datasource, sort and group options). Wish there was a way to hide that
Nice one, glad you found it useful
Here is another BONUS TIP #2
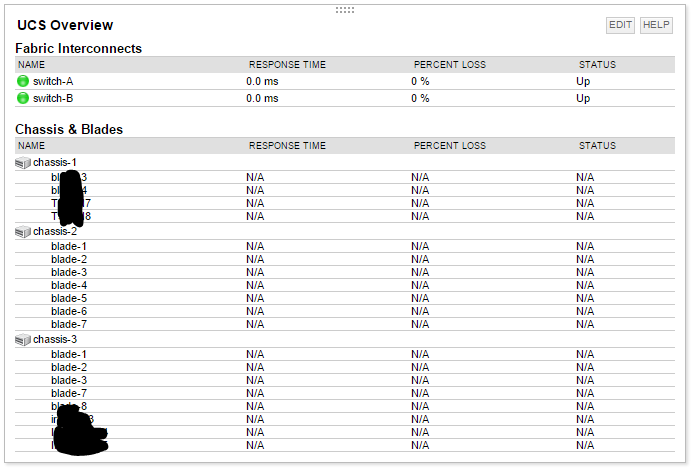
To be able to display links and status icon - you can use the following display types on both NODE and INTERFACE columns:
* Details Page Link + Enable tooltips* Status Icon (Watermark)
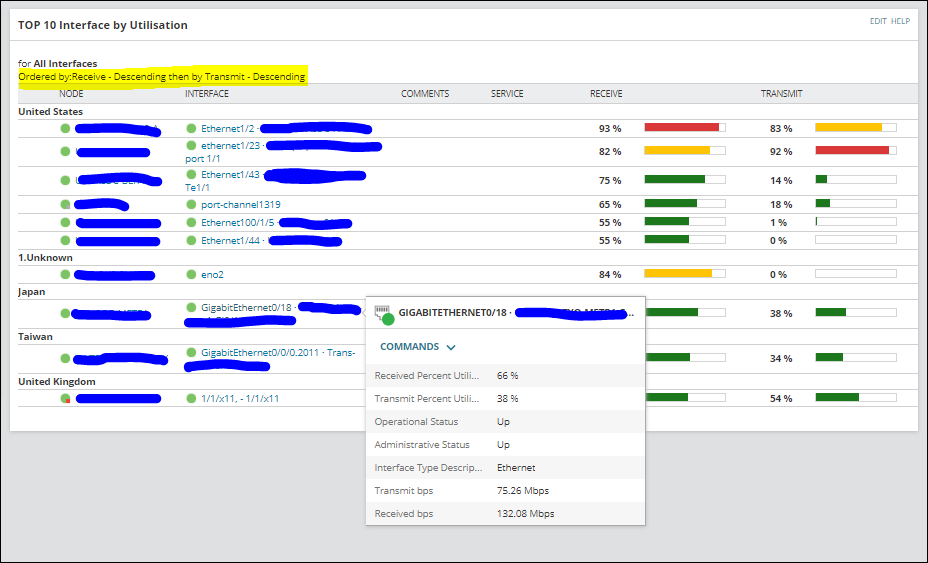
plus, you can also add custom properties from node level as well and even define grouping if needed (I have done this below for Country CP from node level)
I would also advise you to use CUSTOM columns size to keep things neat. You can set them in preview mode:
here is a result:
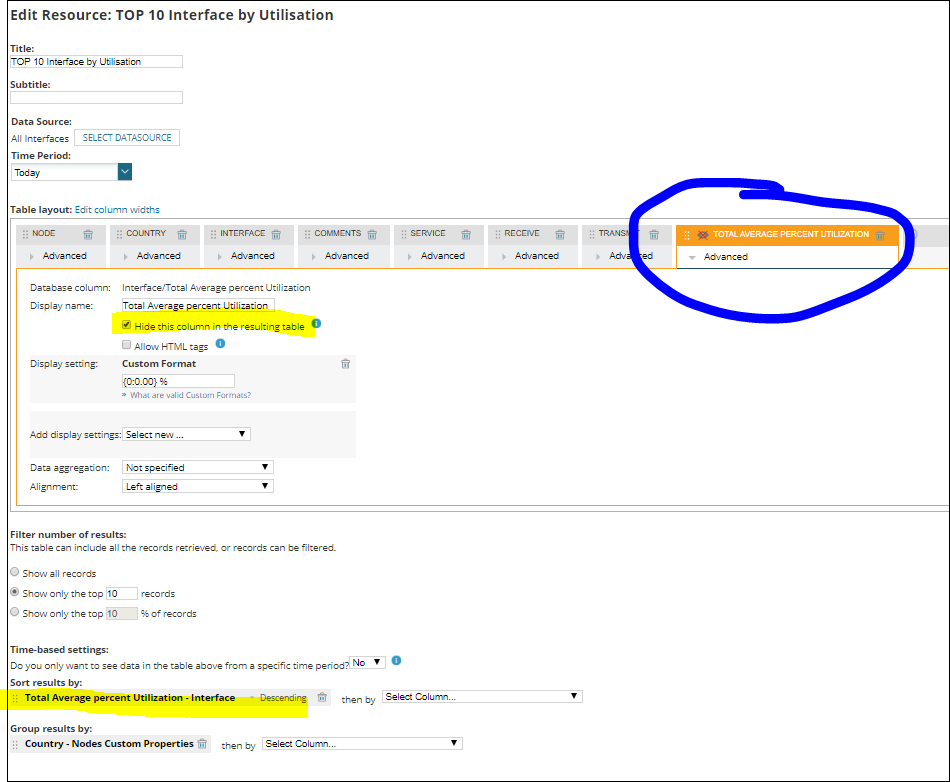
Oops ... and a word of WARNING:
It seems that when ordering first be receive then by transmit you potentially can loose visibility to some high transmit interfaces. Use this instead:
1. Add column TOTAL AVG PERCENT UTILIZATION2. Hide this column3. Sort results in descending order by this column