I am trying to chart the data that SolarWinds can now natively pull from certain UPS devices but no matter what I try I can't get the data to show. Has anyone been able to do this and if so, how?
Here is an example device. It is pulling out various metrics including output load, battery capacity, temperature, and runtime remaining.
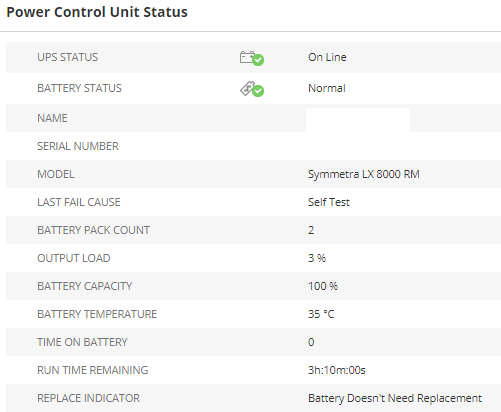
These UPS's have a custom Node Details view and I want to be able to display charts with the above metrics.
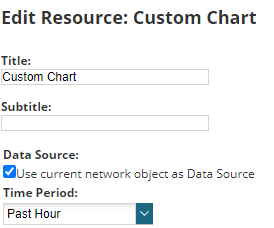
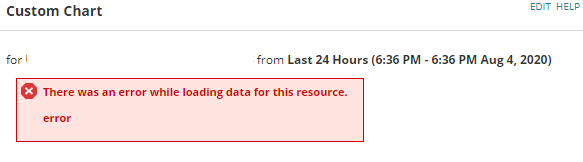
Attempt 1 - Custom Chart
- Add a Custom Chart resource and choose the "Use current object as Data Source".
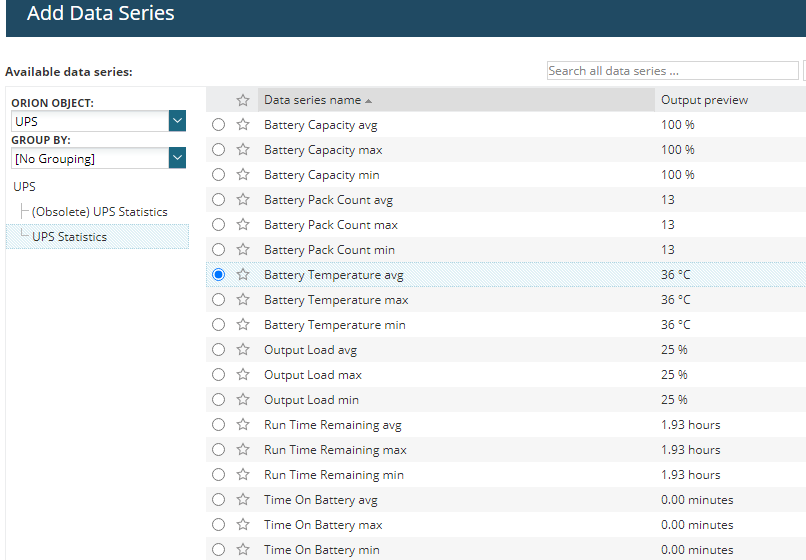
- Change the object to the UPS metrics and pick a metric, e.g. temperature
- No matter what Time Period or interval I select, the chart shows the following error: "There was an error while loading data for this resource. error"
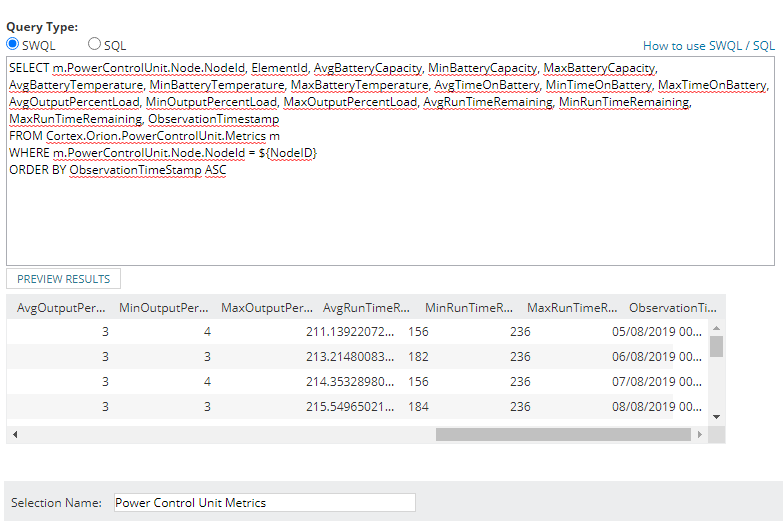
Attempt #2 - Custom Chart with a custom query datasource
- Add a Custom Chart resource and choose a new datasource with a SWQL query. I brought out a whole bunch of different metrics in the query but none worked.
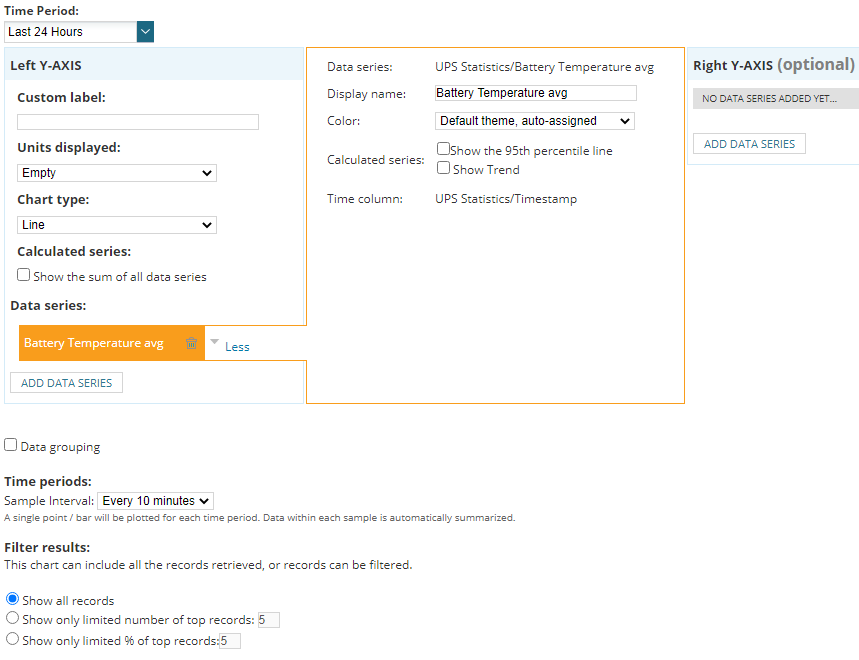
- When adding the data series to the axis, no matter which metric I tried to display, same error.
- No matter what Time Period or interval I select, the chart shows the following error: "There was an error while loading data for this resource. error"
SELECT m.PowerControlUnit.Node.NodeId, ElementId, AvgBatteryCapacity, MinBatteryCapacity, MaxBatteryCapacity, AvgBatteryTemperature, MinBatteryTemperature, MaxBatteryTemperature, AvgTimeOnBattery, MinTimeOnBattery, MaxTimeOnBattery,  AvgOutputPercentLoad, MinOutputPercentLoad, MaxOutputPercentLoad, AvgRunTimeRemaining, MinRunTimeRemaining, MaxRunTimeRemaining, ObservationTimestamp
FROM Cortex.Orion.PowerControlUnit.Metrics m
WHERE m.PowerControlUnit.Node.NodeId = ${NodeID}
ORDER BY ObservationTimeStamp ASC
Any suggestions?