Hi,
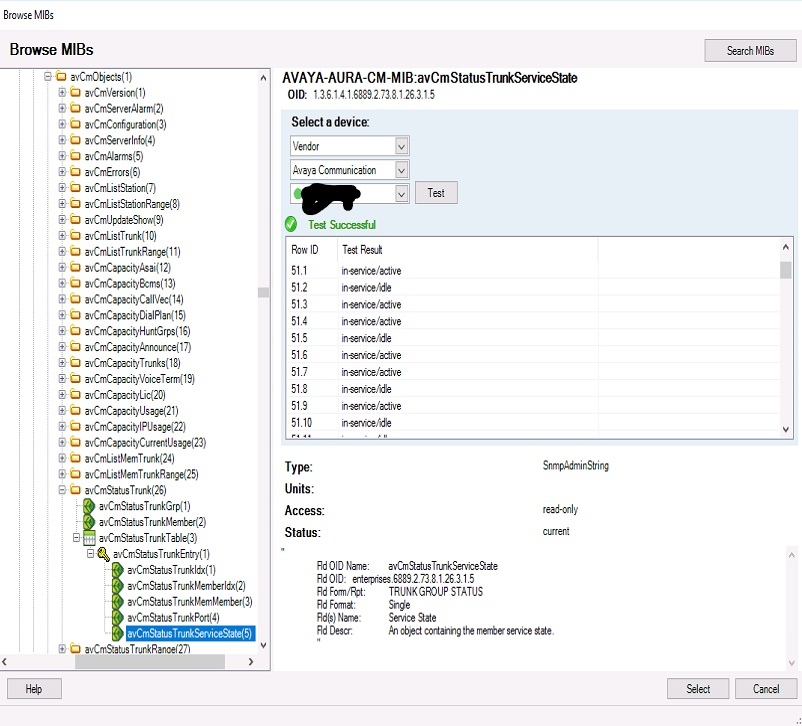
I have recently added a new UDP for our Avaya SIP calls, it shows us the details of each trunk in the system and if they are active or available. This is something that we can use the identify call trends and capacity issues. I can get the data so I can see all the trunk lines we have and their status.
I can enter this into a Table, use a query to just capture "in use" and count this up to get a total. Great. I have a figure that now updates as it polls.
What I want is this data in a graph/chart, but I dont have the option or I am not doing it right. I am using the OID in the table below, using a "Get Table" option in the UDP and returning all I can.